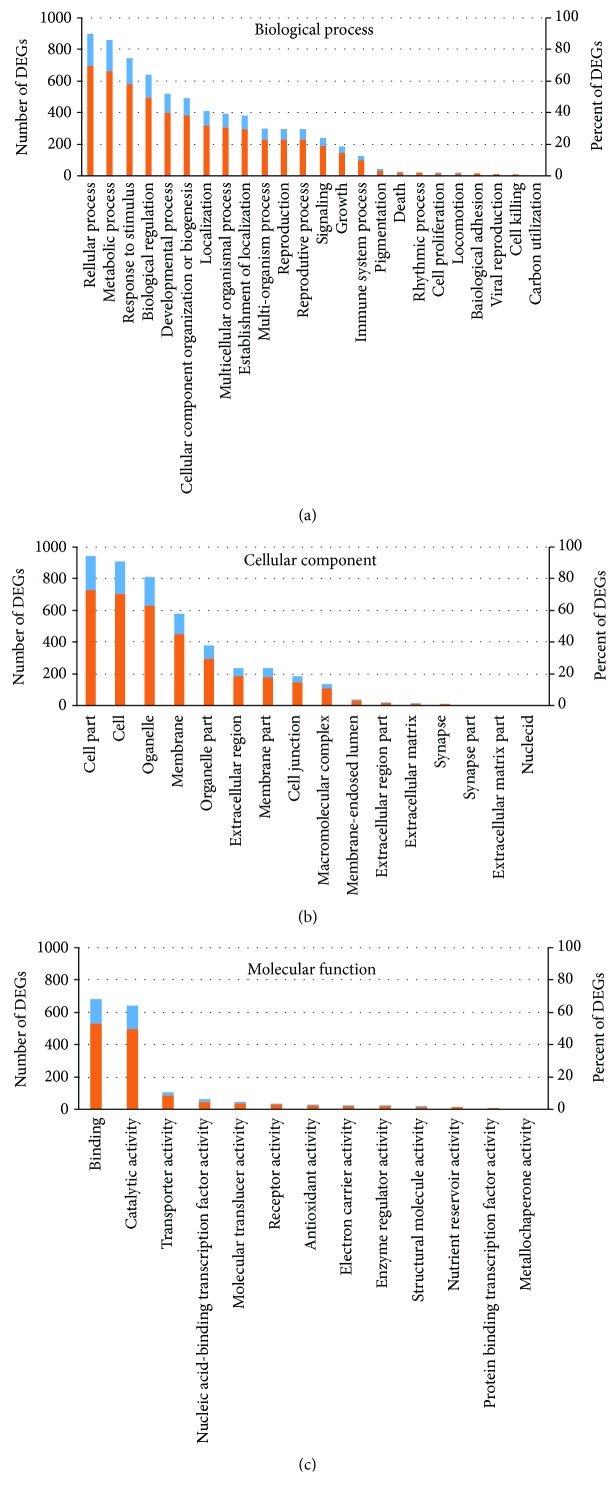
Figure 5.
Gene Ontology (GO) enrichment of differentially expressed genes (DEGs) in drought-stressed hemp. The results are summarized in three main categories: biological processes (a), cellular components (b), and molecular functions (c). The blue (corresponding to the left y-axis) and orange columns (corresponding to the right y-axis) represent the number and percent of DEGs in that category, respectively.

