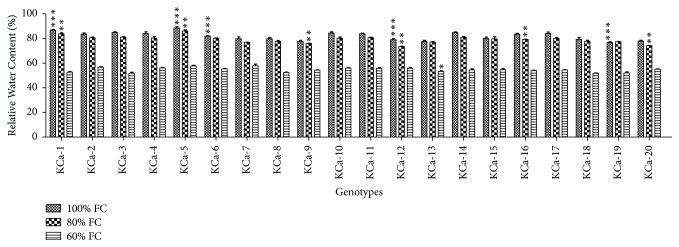
Figure 7.
Relative water content in seedlings of twenty hot pepper genotypes at control and stress conditions. Data mentioned is mean values of three replicates ± SD. ∗∗∗ indicates significant difference within 100% FC, ∗∗ indicates significant difference within 80% FC, and ∗ indicates significant difference within 60% FC among genotypes at 0.01 level of probability.

