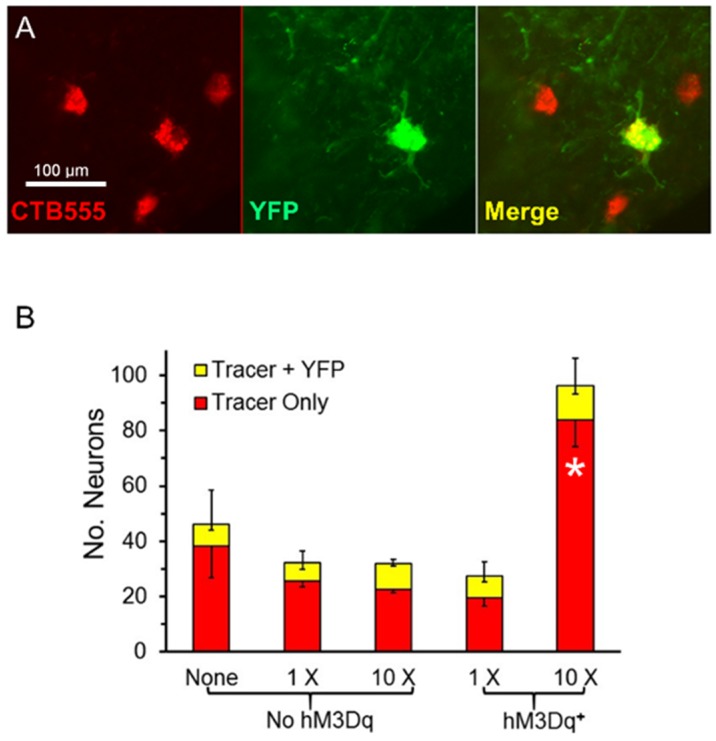
Figure 3.
(A) Examples of singly and doubly labeled motoneurons in the spinal cord (40×). (B) Mean number of retrogradely labeled neurons four weeks after sciatic nerve transection and repair. The red portion of each bar represents the numbers of neurons containing only the retrograde fluorescent tracer used; the yellow portion the number of cells containing both the tracer and YFP. Positive error bars are the SEM (N = 4) for total motoneuron (tracer + tracer and YFP) numbers; downward error bars tracer only and tracer + YFP groups. * = p < 0.05 vs. all other groups.

