
Table 2.
Recent reported structures with BACE1 inhibitory activity.
| Scaffold | In vitro activity | Reference | Scaffold | In vitro activity | Reference |
|---|---|---|---|---|---|
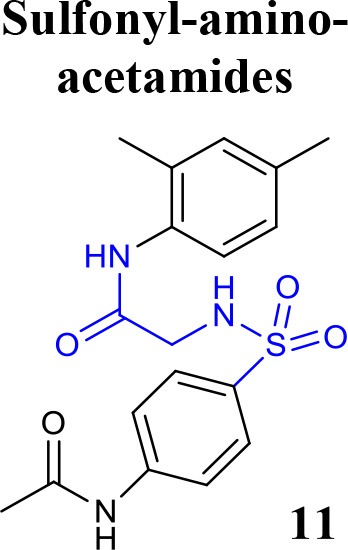 |
BACE1 IC50 = 7.90 μM %inhibition BACE1 at 10 μM = 61.90% |
Jain et al., 2016a | 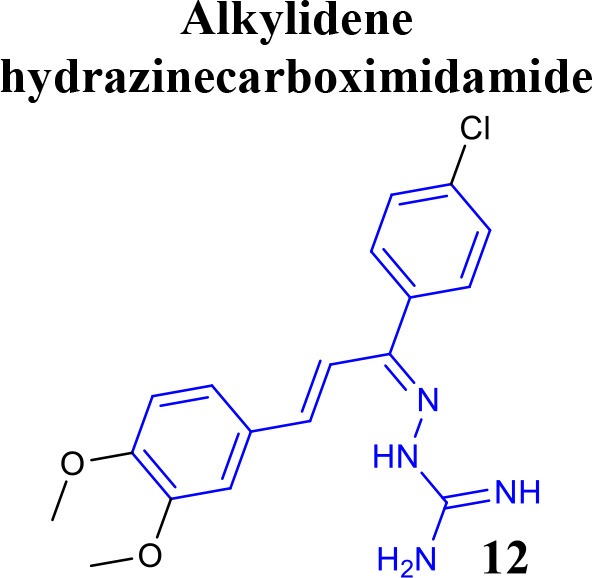 |
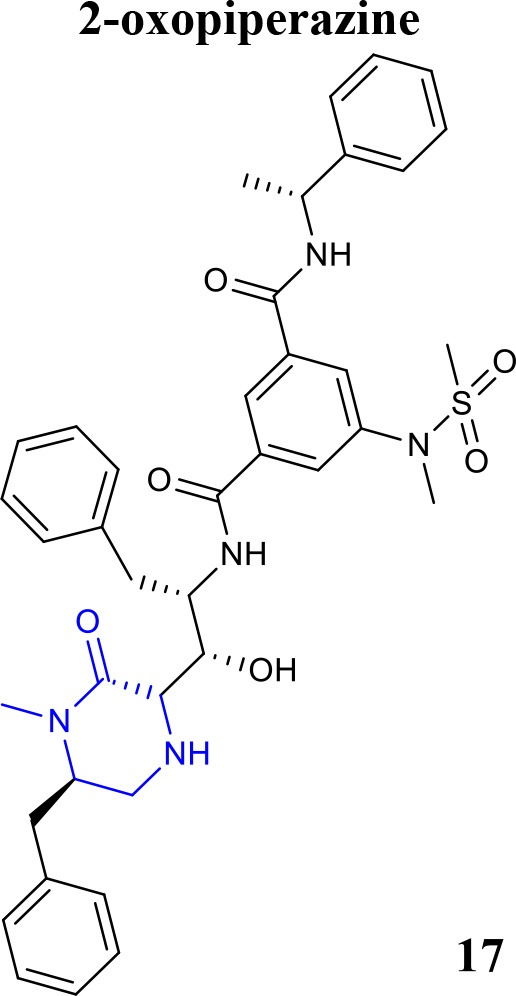
BACE1 IC50 = 6.42 μM %inhibition BACE1 at 10 μM = 78.23% |
Jain et al., 2016b |
 |
BACE1 IC50 = 0.12 μM PC12-APPSW Cell IC50 = 1.7 μM BACE2 IC50 = 8.9 μM %inhibition CatD at 10 μM = 5.7% CatD IC50 >> 10 μM |
De Tran et al., 2016 | 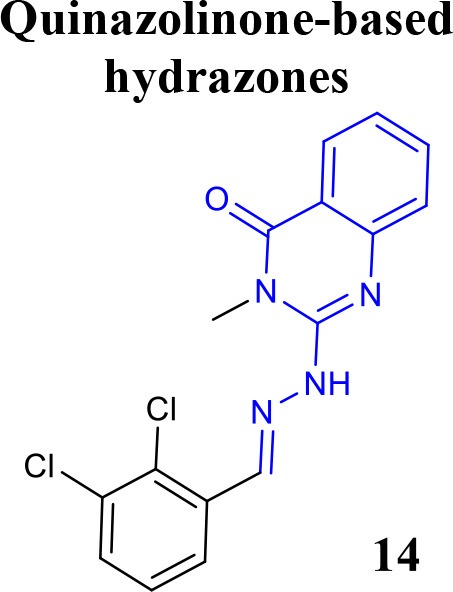 |
BACE1 IC50 = 3.7 μM %inhibition BACE1 at 10 μM = 66.0% |
Haghighijoo et al., 2017 |
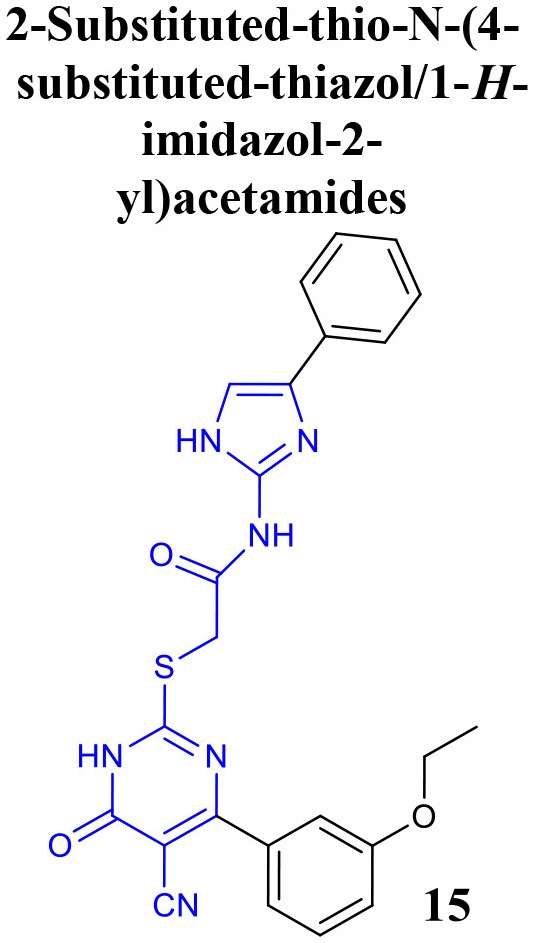 |
BACE1 IC50 = 4.6 μM %inhibition BACE1 at 10 μM = 84.5 % |
Yan et al., 2017 | 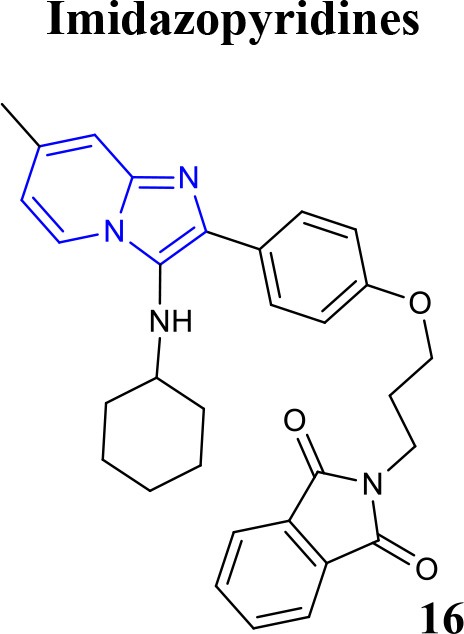 |
BACE1 Ki = 4.38 nM BACE1 IC50 = 2.84 μM %inhibition BACE1 at 10 μM = 61.32% |
Azimi et al., 2017 |
 |
BACE1 Ki = 12 nM | Ghosh et al., 2017 |