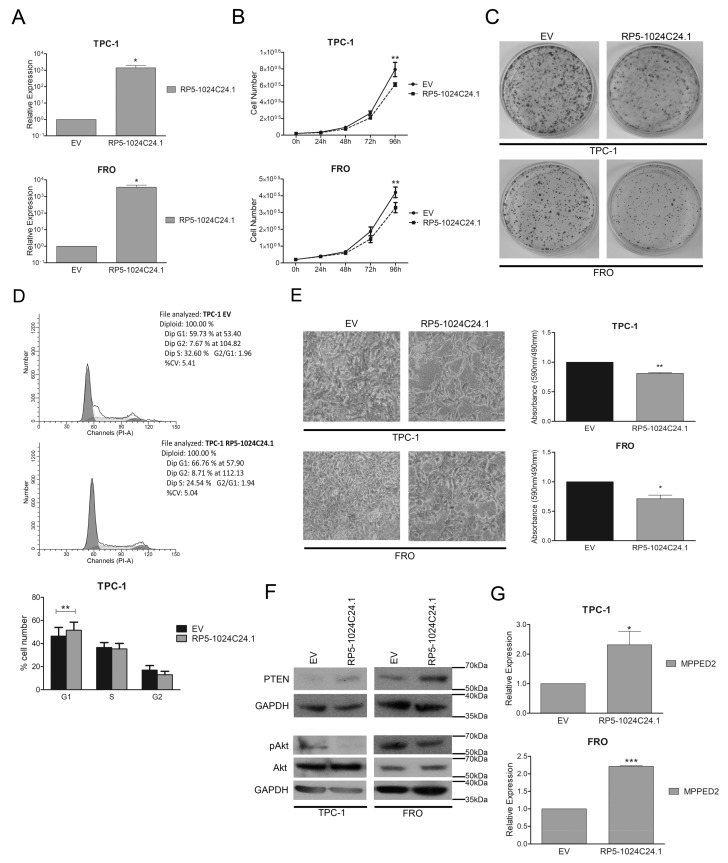
Figure 3.
RP5-1024C24.1 reduces cell migration and proliferation of thyroid carcinoma cell lines. (A) qRT-PCR analysis performed on TPC-1 and FRO cell lines stably carrying RP5-1024C24.1 or the corresponding empty vector (EV). Results were obtained from four independent experiments. Data were compared to EV, set equal to 1, and reported as relative expression ± SEM. t-test; * p < 0.05. (B) Cell growth analysis of TPC-1 and FRO stably carrying RP5-1024C24.1 or EV. Cell number was evaluated at 24 h, 48 h, 72 h and 96 h after seeding. Values were obtained from three independent experiments performed in duplicate. Data were reported as mean ± SEM. 2-way Anova-test followed by Bonferroni post-test; ** p < 0.01. (C) Representative colony assay performed on TPC-1 and FRO cell lines stably carrying RP5-1024C24.1 or EV. (D) Representative cell cycle analysis of TPC-1 cell lines stably carrying RP5-1024C24.1 or EV. Cell number was reported on the y-axis while the percentage of propidium iodide (PI) incorporated was reported on the x-axis (upper panel). Values shown in the lower panel were obtained from five independent experiments. t-test; ** p < 0.01 compared to EV cells. (E) Representative acquisition of migration assays performed on TPC-1 and FRO stably carrying RP5-1024C24.1 or EV (magnification 40×) (left panel). Data obtained from three (TPC-1) or four (FRO) independent experiments are shown in the right panel. Values were reported as mean value ± SEM and compared to the EV, set equal to 1. t-test; * p < 0.05; ** p < 0.01. (F) Immunoblot analysis performed on TPC-1 and FRO cell lines stably carrying RP5-1024C24.1 or EV to analyze the protein level of PTEN, Akt and pAkt. GAPDH was used to normalize the amount of loaded protein. (G) MPPED2 expression evaluated by qRT-PCR in TPC-1 and FRO stably expressing RP5-1024C24.1. Data were obtained from five (TPC-1) or three (FRO) independent experiments. Values were reported as relative expression ± SEM and were compared to the EV, set equal to 1. t-test; * p < 0.05; *** p < 0.001.

