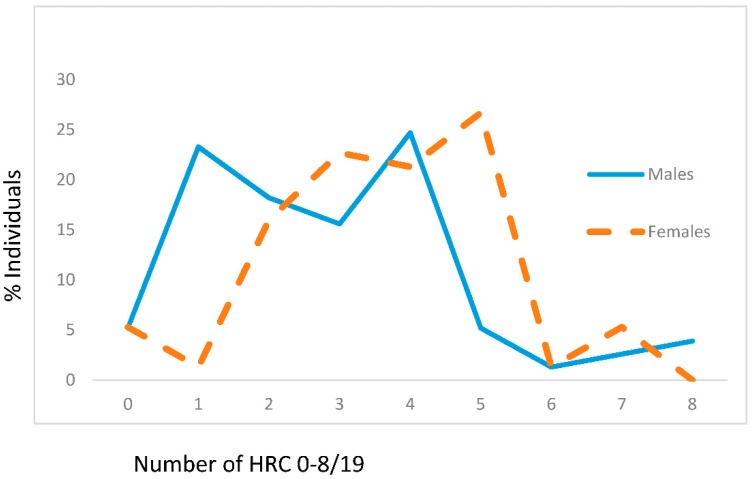
Figure 1.
Frequencies of homozygous recessive characteristics (hrc) in males and females of the control group. X—mean values with standard deviation, V—variability, z—Mann Whitney U test. Males: n = 77, xhrc/19 = 2.88 ± 1.89 (95% CI 2.42–3.28). Females: n = 75, xhrc/19 = 3.65 ± 1.60 (95% CI 3.29–4.02; z = −3.164, p = 0.002). VMales = 65.63%, VFemales = 43.84%.

