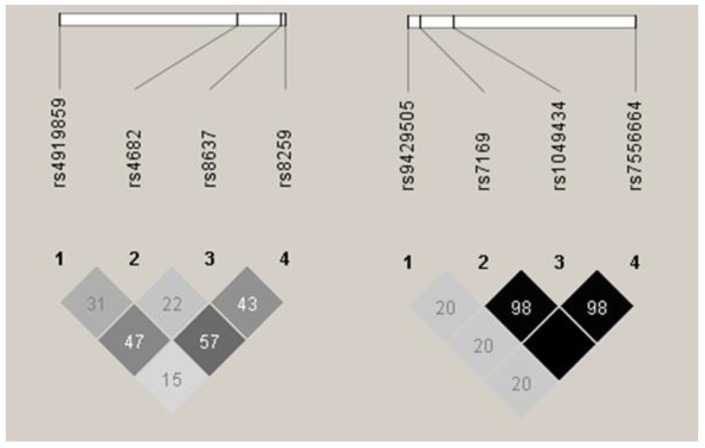
Figure 1.
Linkage disequilibrium (LD) between single nucleotide polymorphisms (SNPs) under study. Basigin (BSG) SNPs are shown to the left, and monocarboxylic acid transporter 1 (SLC16A1, MCT1) to the right. Darker colour shows higher r2 values, while the value shown inside the squares is r2 × 102. Results as presented by the Haploview 4.2 software [15].

