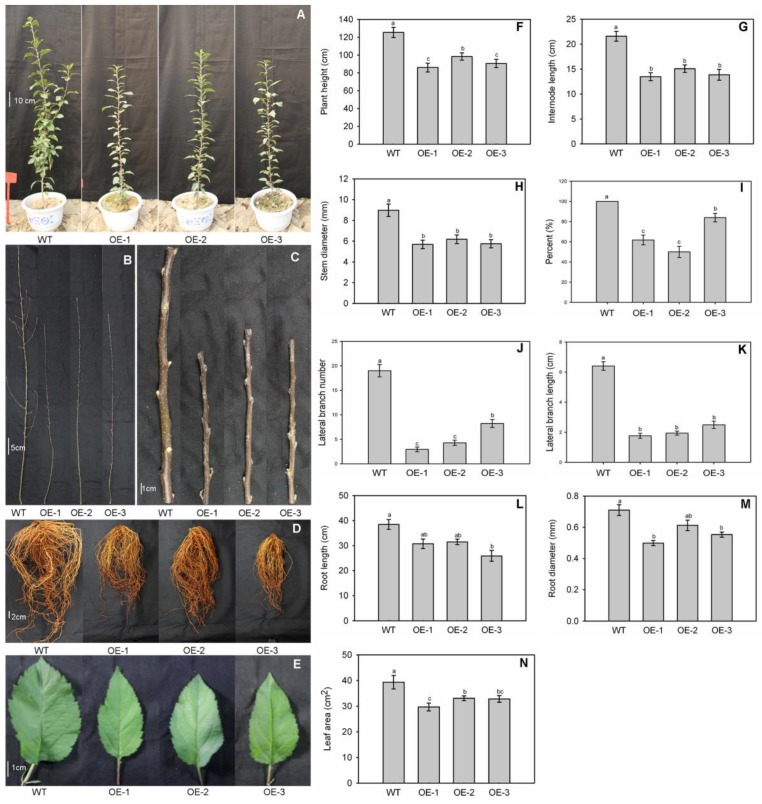
Figure 3.
Dwarf phenotype in overexpression lines of MdNAC1. (A) Transgenic plants had smaller plant size and (C) internodes length. (B) They also featured changes in lateral branch architecture, smaller roots (D) and leaves (E), and (F) lower values for plant height, (G) internode length, (H) stem diameter, (L) root length, (M) root diameter, and (N) leaf area. (I) Transgenic plants had lower shoots with lateral branches, (J) lower lateral branches, and (K) shorter lateral branches. The data for Figure 3I–K are presented as means ± standard errors; The data for other Figures are presented as means ± standard deviations. Different letters above the bars indicate the significant difference among these data at a level of p < 0.05 according to Tukey’s multiple comparison test. Any data sharing a same letter means there is no significant difference at this significant level. a: Subset label showing one or more sets of data with the largest mean value(s); b: Subset label showing one or more sets of data with the second-largest mean value(s); c: Subset label showing one or more sets of data with the third-largest mean value(s).

