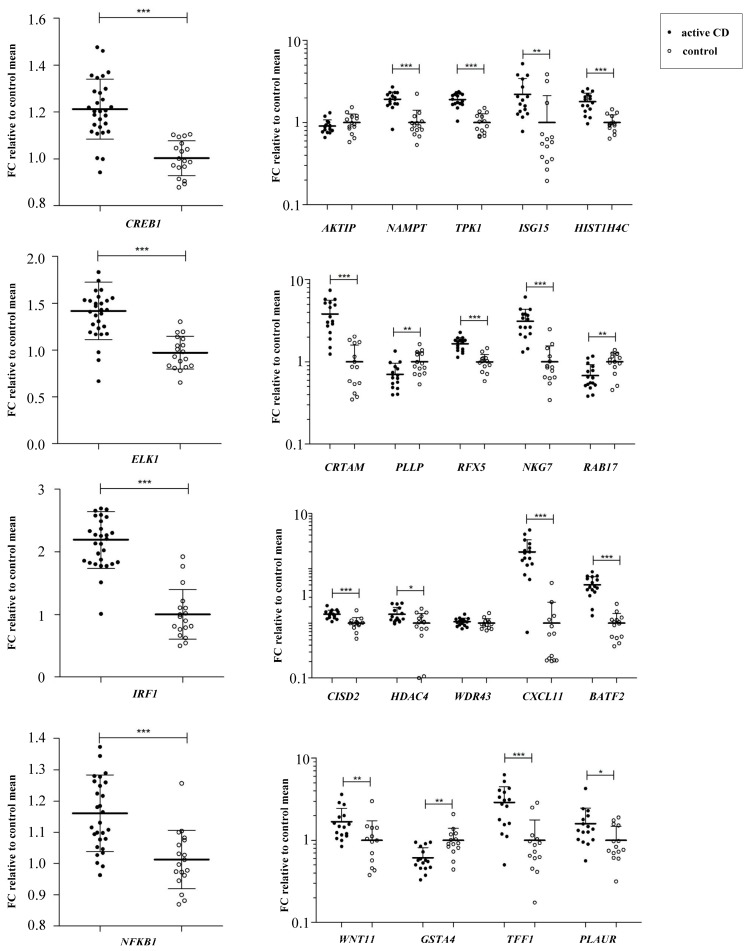
Figure 3.
Gene expression analysis. Gene expression analysis of TFs identified by WGCNA (active CD n = 30, control n = 18) and their target genes (active CD n = 16, control n = 14) in duodenal biopsies. Data are expressed as mean ± SD (standard deviation) (*** p < 0.001, ** p < 0.01 and * p < 0.05).

