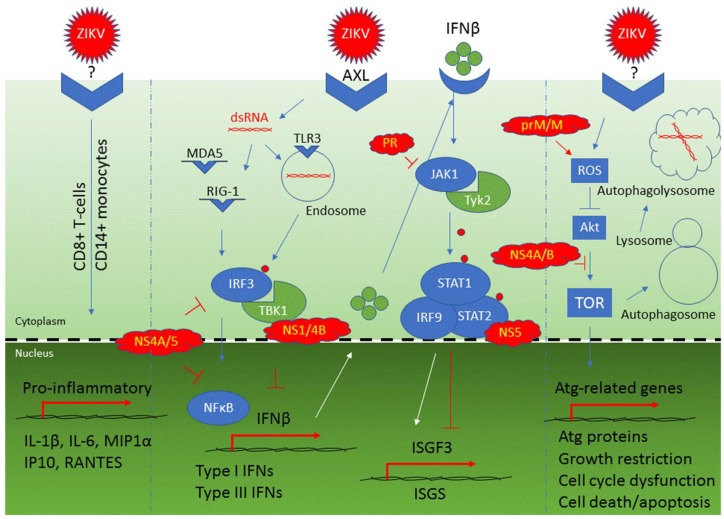
Figure 2.
This figure illustrates Zika virus interactions with host cells. The Zika virus or proteins are colored in red. Cellular receptors or proteins that are affected by ZIKV are shown in blue. Cellular proteins shown in green are regulatory proteins such as kinases. Three Zika viruses are used here to show ZIKV-induced T-cell responses (left), ZIKV-mediated type I and type III IFNs productions (middle) and ZIKV-triggered autophagy (right). → indicates a positive interaction. ┤ denotes inhibitory action. Small red dots are used to indicate phosphorylation.

