Figure 1.
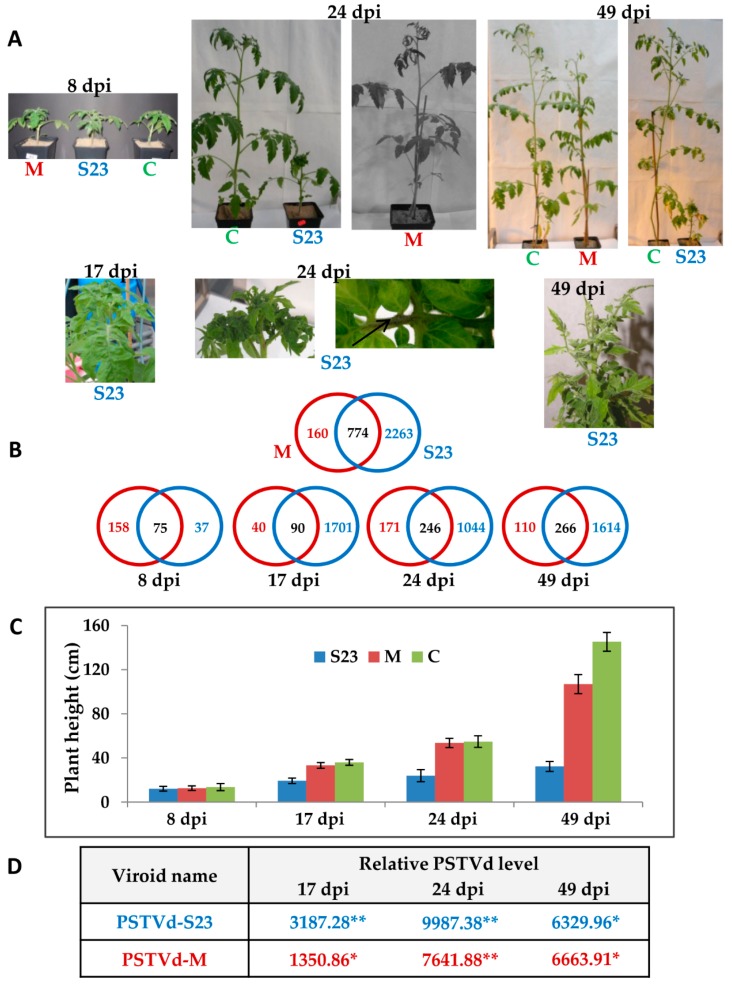
Time course of symptom development of PSTVd infection on “Rutgers” tomato in correlation with viroid RNA level and number of DEGs. (A) Comparison of symptoms induced by the mild and severe PSTVd variants. Typical necrosis caused by S23 at 24 dpi are indicated by arrow. (B) Venn diagrams of the DEGs: total DEGs in M and S23 infected plants, and at the indicated time points. (C) Comparison of plant heights at 4 time points. Each bar represents the arithmetic mean of the height of three plants with SD indicated. C, control plant (pUC9 vector-inoculated). (D) Relative viroid level measured by the NanoString nCounter method. Relative viroid level in arbitrary units in comparison to control plants was estimated using nSolver analysis software (v. 3.0, NanoString Technology, Seattle, WC, USA). A t-test was used to determine the significance of the differences; * and ** indicate p < 0.05 and p < 0.001, respectively.

