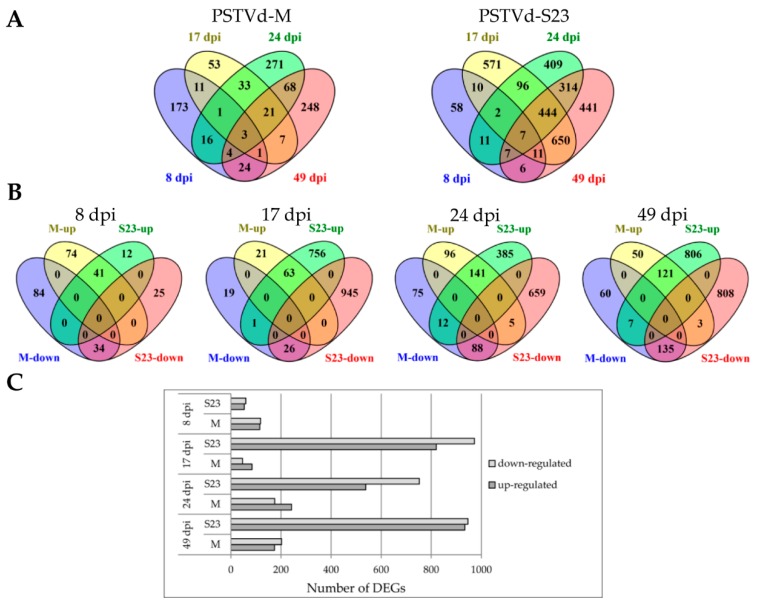
Figure 2.
Relationship of DEGs at different time points. (A) Venn diagrams display the distribution of DEGs at each time point during mild or severe infection. (B) Venn diagrams display the distribution of up- and down-regulated genes in both infections at each time point. (C) Comparison of the number of up- and down-regulated genes at each time point.

