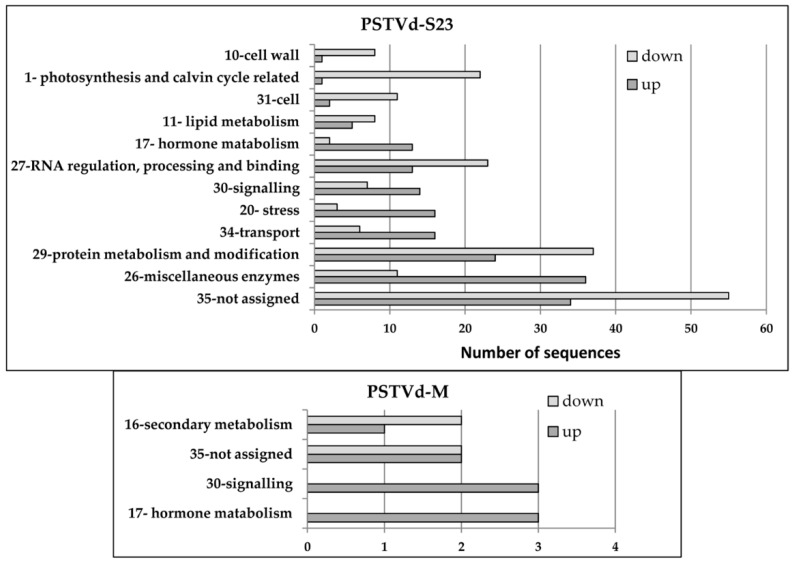
Figure 3.
Functional analysis of DEGs commonly identified at three time points by MapMan. DEGs from the up- and down-regulated groups were assigned to 35 bins in the “Overview” visualization pathway of MapMan. The bin numbers and corresponding names are graphed on the Y-axis. Only the most abundant categories for at least one group of genes are presented. Miscellaneous enzymes, e.g., cytochrome P450, CCN5-related N-acetyltransferase, UDP glucosyl and glucuronyl transferases.

