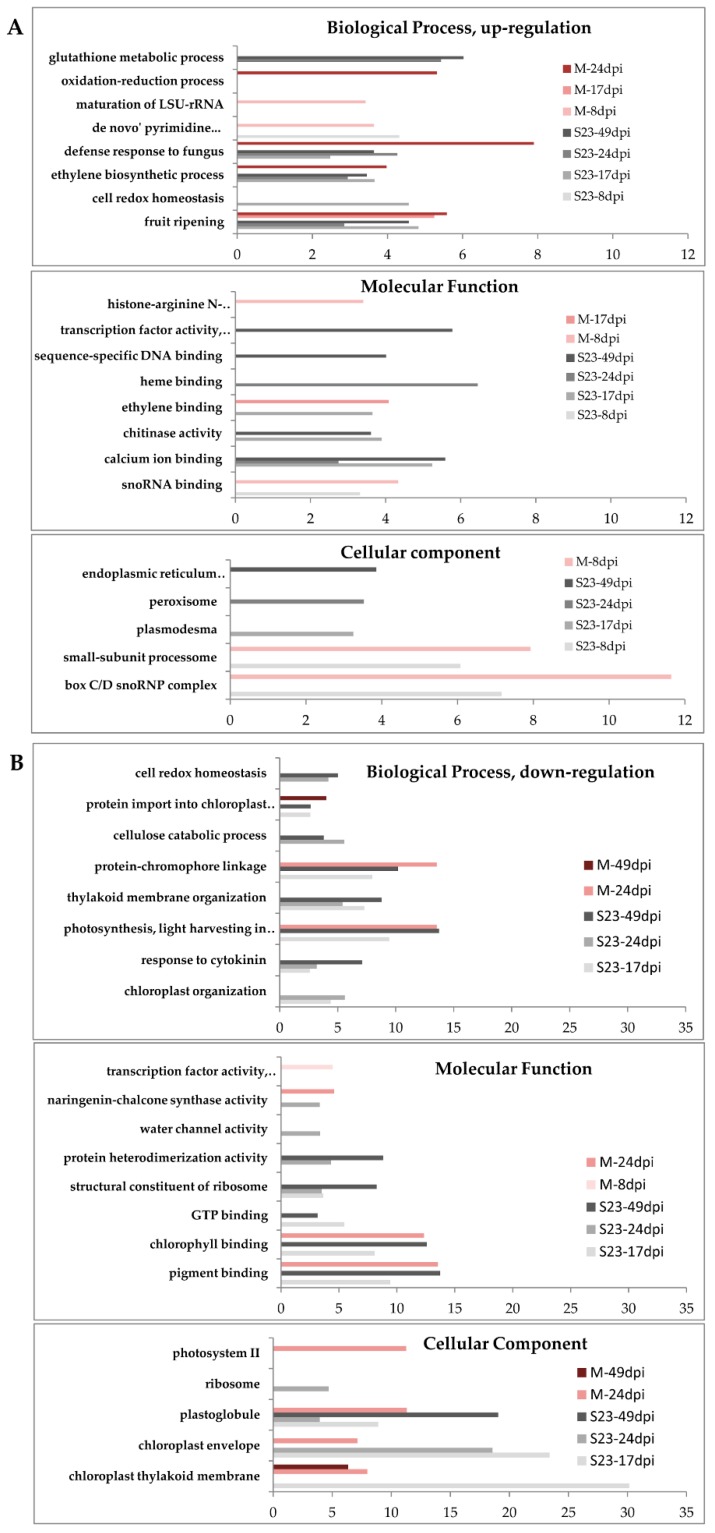
Figure 4.
GO enrichment analysis. (A,B) up- and down-regulated genes, respectively. Only selected GO terms for the S23 and M variants at the indicated times after inoculation are presented. Categories are indicated on the Y-axis, log10(1/p) is on the X-axis; enrichment p value < 0.005 was used as a cutoff.

