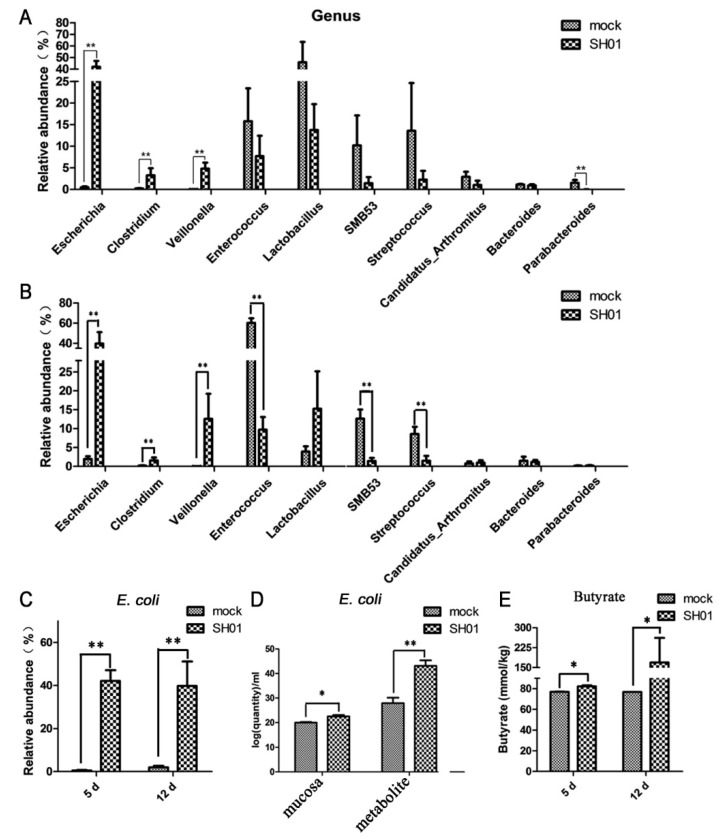
Figure 3.
H9N2 AIV infection mainly affects the relative abundance of 10 variable taxa at the genus level and relative abundance of E. coli at the species level. (A) Spatial distribution of microbial composition at the major genus level at 5 dpi. (B) Spatial distribution of microbial composition at the major genus level at 12 dpi. (C) Spatial distribution of microbial composition at the genus level of E. coli. (D) Quantity of E. coli in ileal contents of mock and SH01 groups by real-time RT-PCR. (E) Quantity of butyrate in ileal contents of mock and SH01 groups. ** p < 0.01, * p < 0.05.

