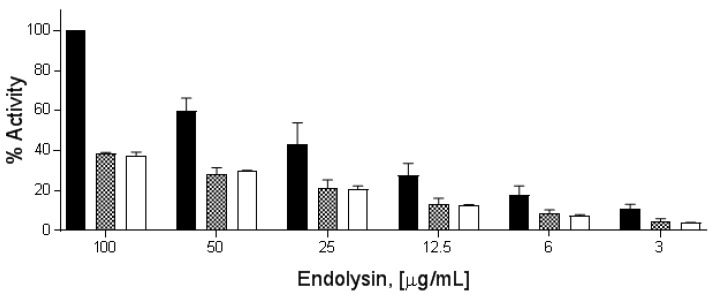
Figure 3.
PlyP56, PlyN74, and PlyTB40 lytic activity comparison. Stationary phase B. cereus ATCC 4342 cells at final OD600 of 1.0 were treated with endolysin doses from 100 μg/mL to 3 μg/mL over 20 min. PlyP56 (black bars), PlyN74 (checker bars), and PlyTB40 (white bars) are indicated. The cell lysis was assayed by turbidity reduction as described in Methods. The % lytic activities were normalized to 100% activity of PlyP56 (black bars) at 100 μg/mL. Experiments were run in triplicates on three independent days. The error bars represent standard deviation.

