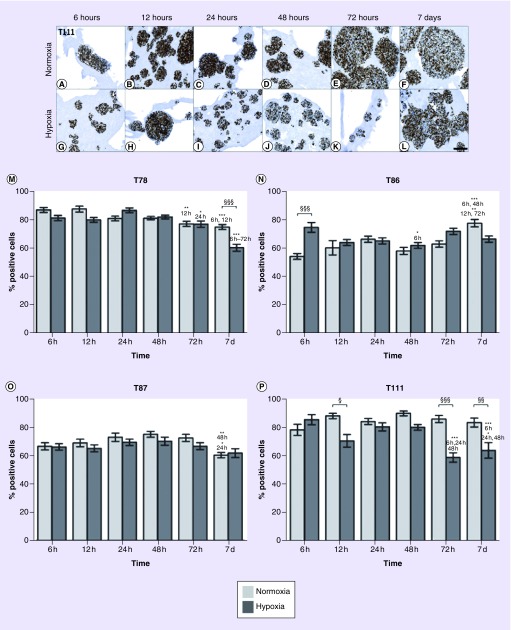
Figure 2. . Proliferation level over time.
The expression of Ki-67 showed a minor decrease in hypoxia compared with normoxia in T111 (A–L). Percentage of Ki-67 positive cells in T78 (M), T86 (N), T87 (O) and T111 (P) after culturing in normoxia (light bars) or hypoxia (dark bars) in time intervals between 6 h and 7 days. Statistical significances between normoxic and hypoxic samples are marked with §, while * indicates statistical significances within the same group (normoxia or hypoxia). Scale bar 100 μm.
T78: Mesenchymal subtype; T86: Classical subtype; T87: Proneural subtype; T111: Mesenchymal subtype.

