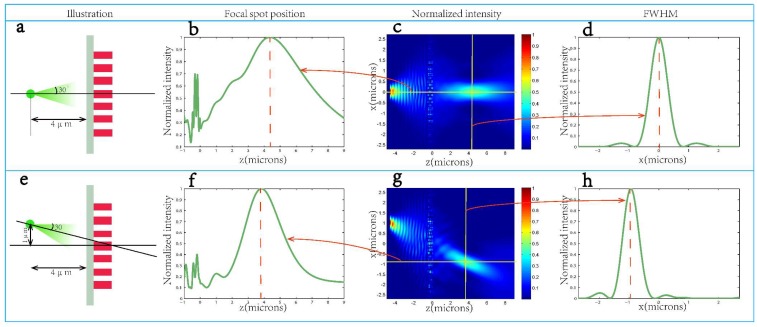
Figure 9.
(a) Schematic for simulating imaging of an on-axis point source. A point source, modeled as a Gaussian beam with a divergence angle of 30°, is placed 4 μm behind the metalens designed for f = 2 μm; (b–d) The calculated steady electric field intensity |Ex|2 of the simulation results on the z-axis (b); x-z plane at y = 0 (c) and the vertical cut of the focal line (d) for the on-axis imaging; (e) Schematic for simulating imaging of an off-axis point source. The point source is still 4 μm behind the lens and has a 30° divergence angle, but is now 1 μm off axis to the left of the metalens. The incidence angle toward the center of the lens is approximately 14°; (f–h) show the intensity distribution, along z direction while 1 μm off the z axis to the right (f); on x-z plane at y = 0 (g); of the vertical cut of the focal line (h).

