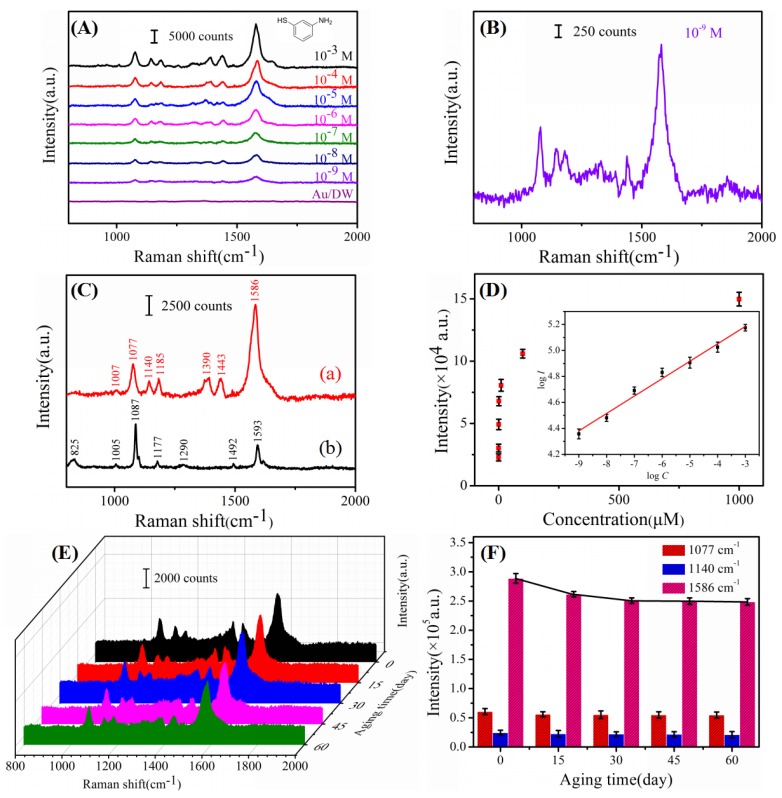
Figure 3.
(A) The Raman spectra of 4-ATP solution at different concentrations detected by the Au/DW substrate and Raman spectrum of Au/DW substrate; (B) The Raman spectra of 10−9 M 4-ATP; (C) SERS spectrum of 10−3 M 4-ATP on the Au/DW substrate (a) and Raman spectrum of solid 4-ATP (b); (D) The relationship between SERS intensity and 4-ATP concentration at 1077 cm−1 and the inset is the linear calibration plot between the SERS intensity and 4-ATP concentration at 1077 cm−1 in logarithm scale; (E) Raman spectra of 10−4 M R6G detected on Au/DW substrate with different periods; (F) Plot of Raman intensities of R6G at 1077, 1140 and 1586 cm−1 versus different aging time (the error bars were calculated based on 10 independent measurements).

