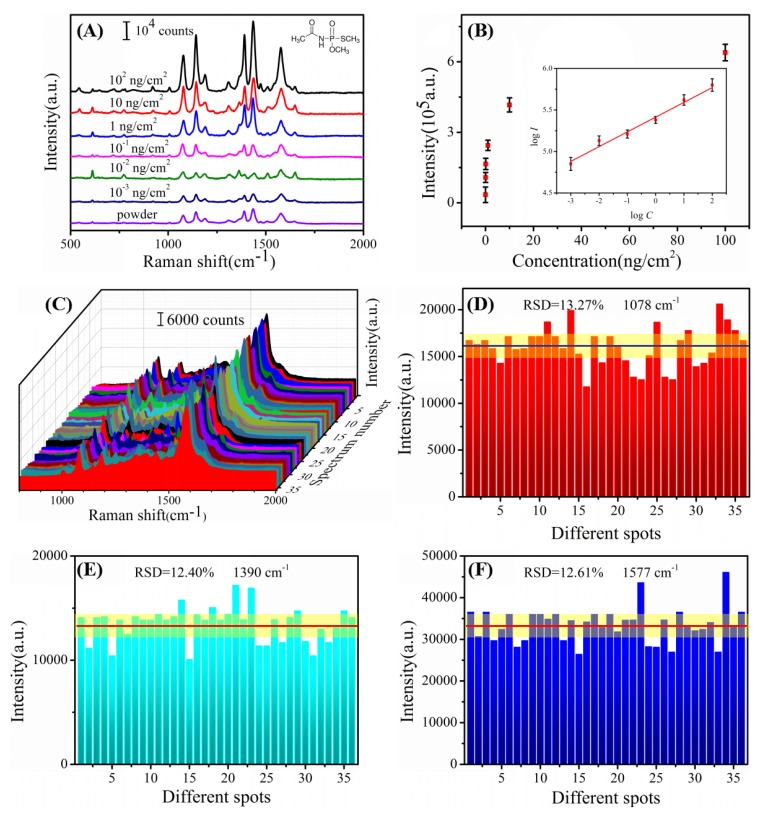
Figure 6.
(A) SERS spectra of APT with different concentrations of 102–10−3 ng/cm2 collected from the surface of apple peels and the Raman spectrum of APT powder; (B) Raman intensity of APT from apple peels samples at 1577 cm−1 by using Au/DW substrate (linear calibration plot between the Raman intensity and acephate concentrations); (C) SERS spectra of 10 ng/cm2 APT collected from 5 apple peels samples via the “press and peel off” method by using the Au/DW substrate; (D–F) the main Raman vibrational intensities of 10 ng/cm2 APT at characteristic Raman peaks (D: 1078 cm−1; E: 1390 cm−1; F:1577 cm−1).

