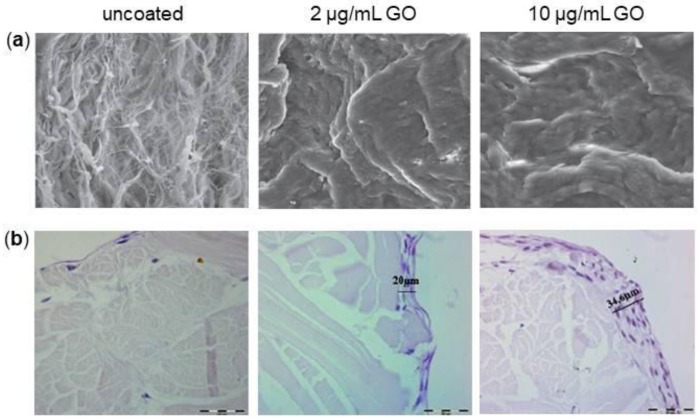
Figure 8.
Different GO coating concentration on collagen membrane from porcine dermis. (a) SEM images of uncoated, 2 μg/mL and 10 μg/mL GO-coated membranes. 4.05 k magnification. (b) Hematoxylin-Eosin staining of uncoated, 2 μg/mL and 10 μg/mL GO-coated membranes with DPSCs after 28 days of culture. 40× magnification. Reproduced with permissions from [144,145].

