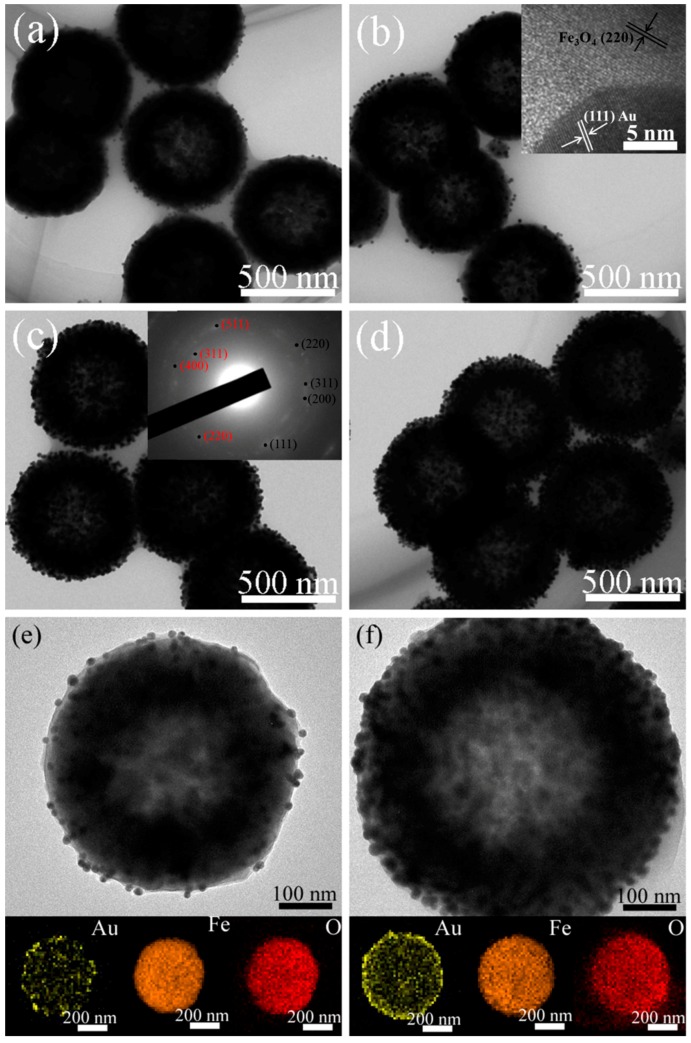
Figure 4.
TEM images of Fe3O4-Au 5 mL (a) and Fe3O4-Au 20 mL with the HRTEM image (inset) (b); Fe3O4-Au 40 mL with the SAED pattern (inset) (c) and Fe3O4-Au 60 mL (d); TEM images of single Fe3O4-Au 5 mL (e) and Fe3O4-Au 60 mL (f) microspheres and corresponding EDS elemental mapping images (Au, Fe and O).

