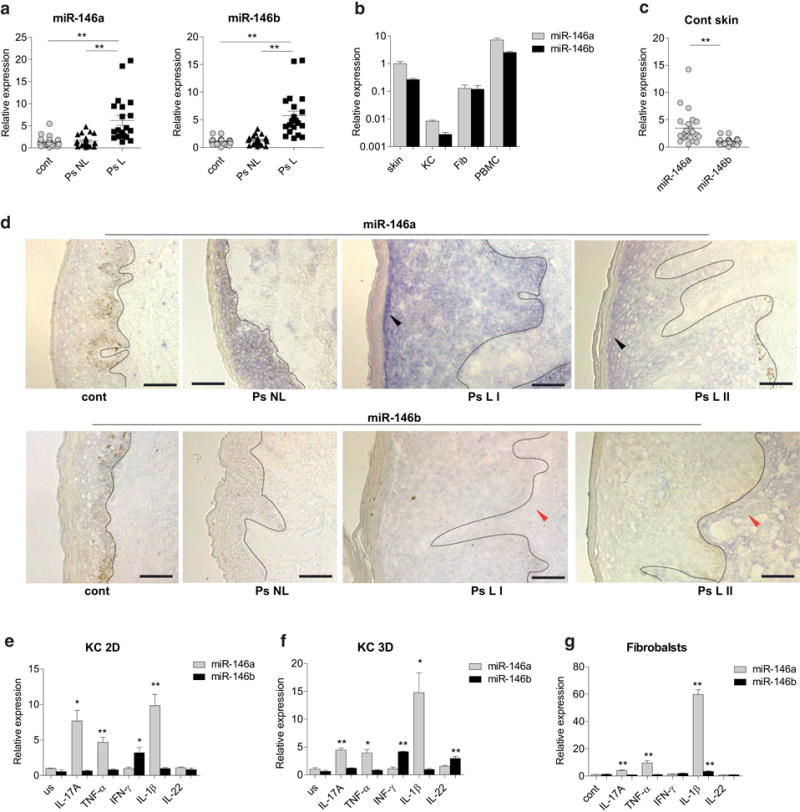
Figure 1. The expression of miR-146a/b in the skin, keratinocytes and fibroblasts.

(a–c) Relative expression of miR-146a/b in lesional (L) and non-lesional (NL) skin from psoriasis (Ps) patients (a), human primary keratinocytes (KC), fibroblasts (Fib) or peripheral blood mononuclear cells (PBMCs)(b) and control skin samples (c) was measured by RT-qPCR and is shown compared to the normal skin (cont). (b) (n=5). (d) ISH images of cont, Ps NL and two Ps L skin biopsies are shown. Blue color shows the expression of miR-146a/b, bar=75 μm. The basement line between the epidermis and dermis is indicated with the dotted line. Stronger signals of miR-146a in the stratum spinosum and miR-146b in the dermis are indicated with black and red arrows, respectively. (e-g) Proliferating keratinocytes (KC 2D), reconstituted epidermis (KC 3D) or fibroblasts were stimulated with for 48 h or left unstimulated (us) and subjected to RT-qPCR analysis. Data is shown compared to the mean expression of miR-146a in us cells (=1), (n=4). (a-c, e-g) Student’s t-test, * P < 0.05, ** P < 0.01.
