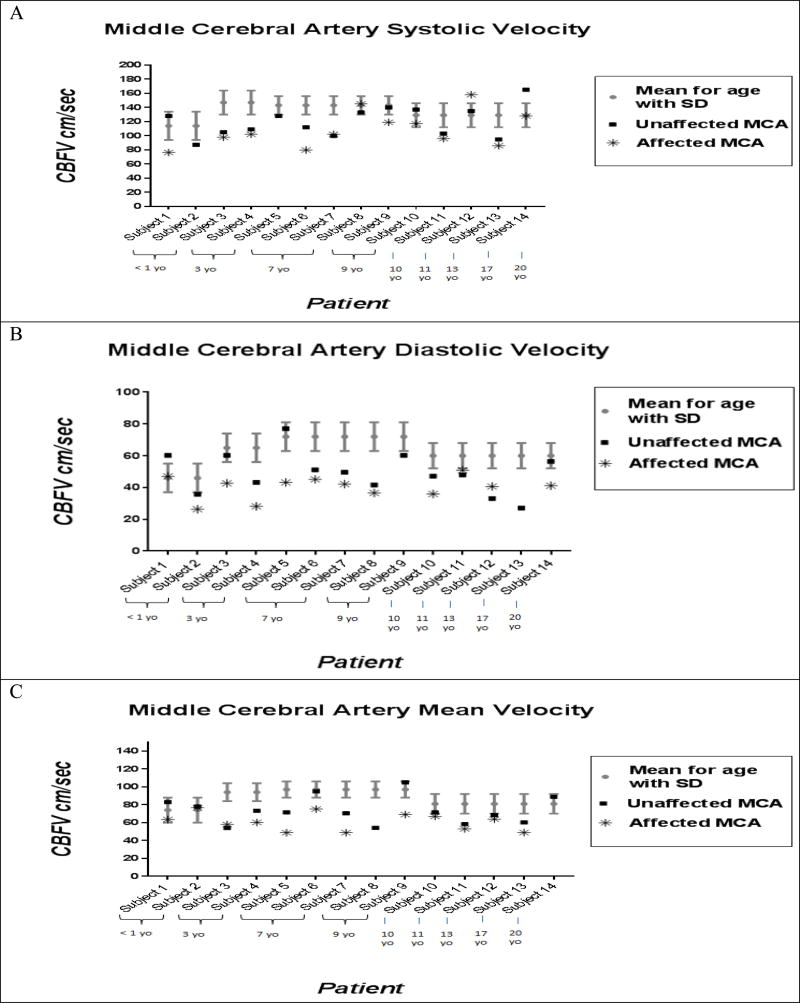
Figure 3.
Comparison of MCA flow velocities in SWS patients compared to previously published age matched controls. Panel A: MCA peak systolic velocities for each patient are shown for the affected and unaffected hemispheres compared to previously published age-matched controls. Panel B: MCA diastolic velocities for each patient are shown for the affected and unaffected hemispheres compared to previously published age-matched controls. Panel C: MCA mean velocities for each patient are shown for the affected and unaffected hemispheres compared to previously published age-matched controls. Subjects are arranged by age in all three panels of Figure 3.

