
Figure 2. Avian dN/dS analysis of α-SNAP genes.
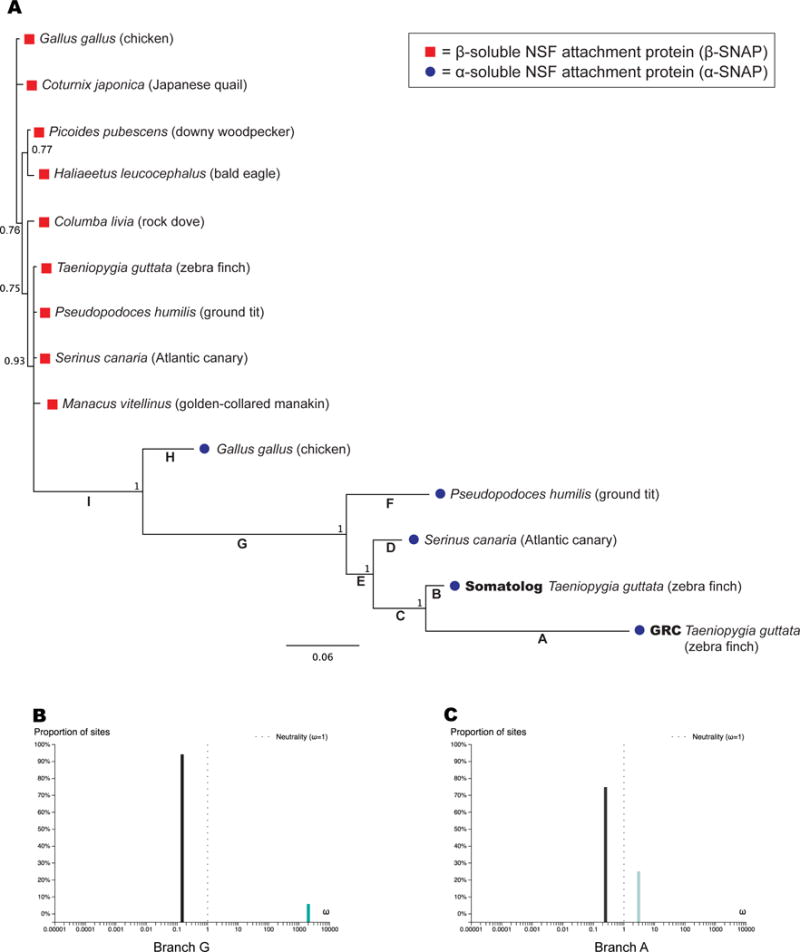
A. Bayesian tree of birds and dN/dS analysis. Red boxes represent β-SNAP; blue dots represent α-SNAP proteins. Branch numbers indicate posterior probabilities and scale bar represents substitutions per site. Branch letters A–I correspond to Table 1 for ω-ratio (dN/dS) estimation of selection pressure. B. Analysis of ω for branch G using aBSREL [24] showing two selective regimes. Positive selection on this branch was statistically significant (p-value 0.0045, Table 1). C. Analysis of ω for branch A using aBSREL [24] showing two selective regimes, with positive selection affecting 25% of sites but at a lower overall level than branch G. See also Figure S3.