Figure 7.
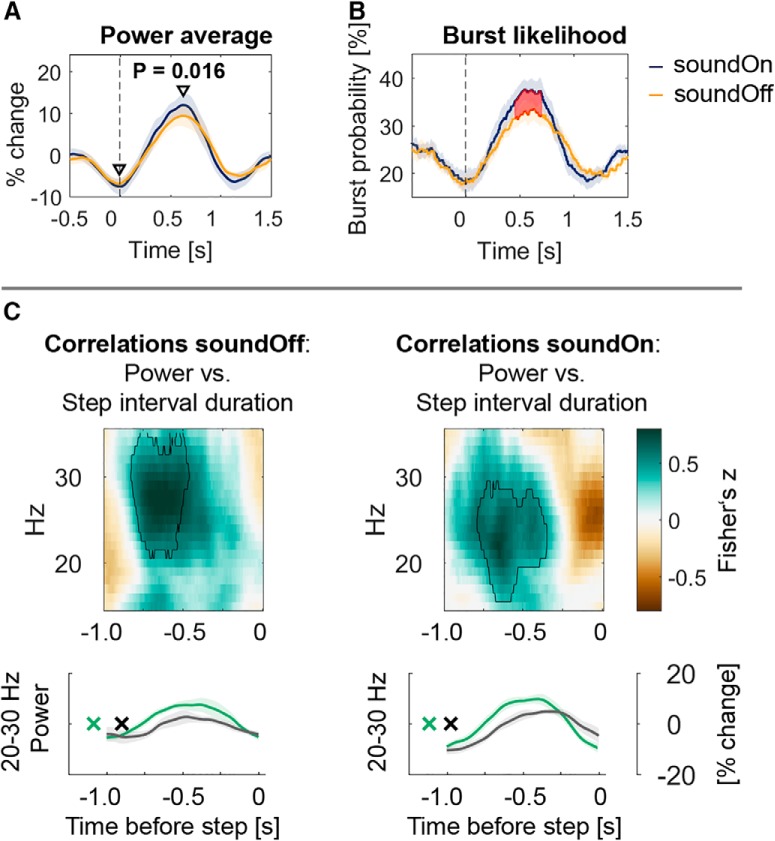
Beta bursts after contralateral heel strikes (at time = 0 s) were more likely when auditory cues were provided. A, Power modulation [max-min(power)] was significantly higher between 28 and 30 Hz during stepping with the metronome compared with stepping without the sound and this difference was mainly driven by an increased beta power peak after the contralateral step (n = 9 patients; t(8) = 3. 05, p = 0.016). B, 28–30 Hz beta bursts (defined as exceeding the 75th percentile of the amplitude) were more likely to occur when the sound was on. This probability mirrors the power average to the left. C, Correlations between STN power and step interval duration. Fisher's z-transformed Spearman correlations were computed between power and the behavioral variable step interval duration between the ipsilateral step at 0 and the preceding step. Encircled green clusters show that when the interval between the two steps was longer, beta power was higher. The same relationship is shown in the power average below (median split data; green, longest intervals; black, shortest intervals). The x denotes the average time of the 50% of all contralateral heel strikes with the longest intervals in green and the shortest intervals (i.e., occurring closer to the step at 0 s) in black.

