Figure 3.
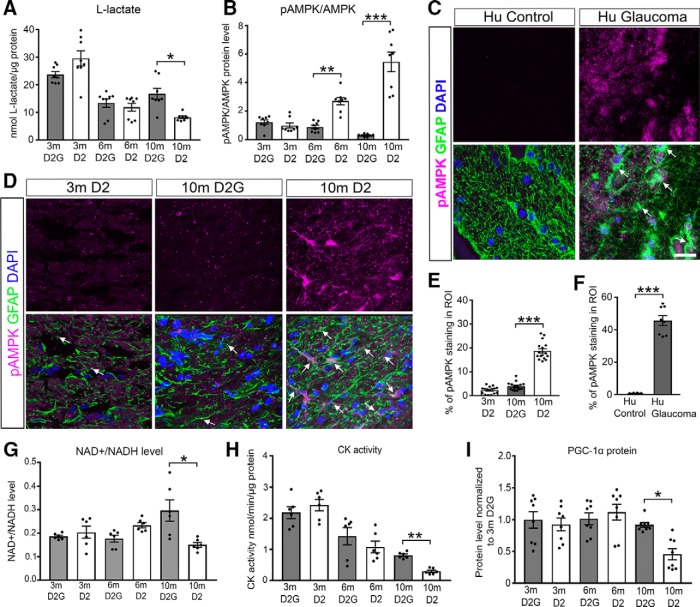
Low lactate level accompanies AMPK activation and limits mitochondrial biogenesis and metabolic cofactor pools. A, l-lactate levels in 3-, 6-, and 10-month-old D2G and D2 ONs (n = 8 ONs/group). B, Ratio of pAMPK to AMPK protein in 3-, 6-, and 10-month-old D2G and D2 ONs (n = 8 ONs/group). C, D, Phosphorylated AMPK immunofluorescence (magenta) and GFAP (green) micrographs (C) of human control and glaucoma ONs (n = 4 sections/ON, 2 ONs/group); and 3-month-old D2, and 10-month-old D2G and D2 mice (n = 3 sections/ON, 6 ONs/group; D). Arrows indicate colocalization of pAMPK and GFAP. E, F, Percentage of mean fluorescence intensity in the ROI for pAMPK 3-month-old D2, and 10-month-old D2G and D2 mice (E) and humans (F). G–I, Analyses of NAD+/NADH, CK activity, and PGC1-α levels in 3-, 6-, and 10-month-old D2G and D2 mice. G, NAD+ normalized to NADH levels (n = 6 ONs/group). See Figure 3-1. H, Creatine kinase activity normalized to total protein (n = 6 ONs/group). I, PGC1-α protein levels normalized to total protein levels and then to 3-month-old D2G protein levels (n = 8 ONs/group). All values are presented as the mean ± SEM, one-way ANOVA and Tukey's post hoc test. A, F(5,42) = 22.04, *p = 0.0124; B, F(5,42) = 35.51, **p = 0.0032, ***p = 0.0001; E, F(2,45) = 208.4, ***p = 0.0001; F, t(14) = 14.79, ***p = 0.0001, two-tailed unpaired t test; G, F(5,30) = 5.061, *p = 0.0012; H, F(5,48) = 38.28, **p = 0.0025; I F(5,42) = 5.43, *p = 0.0231. Scale bar, C, D, 20 μm.

