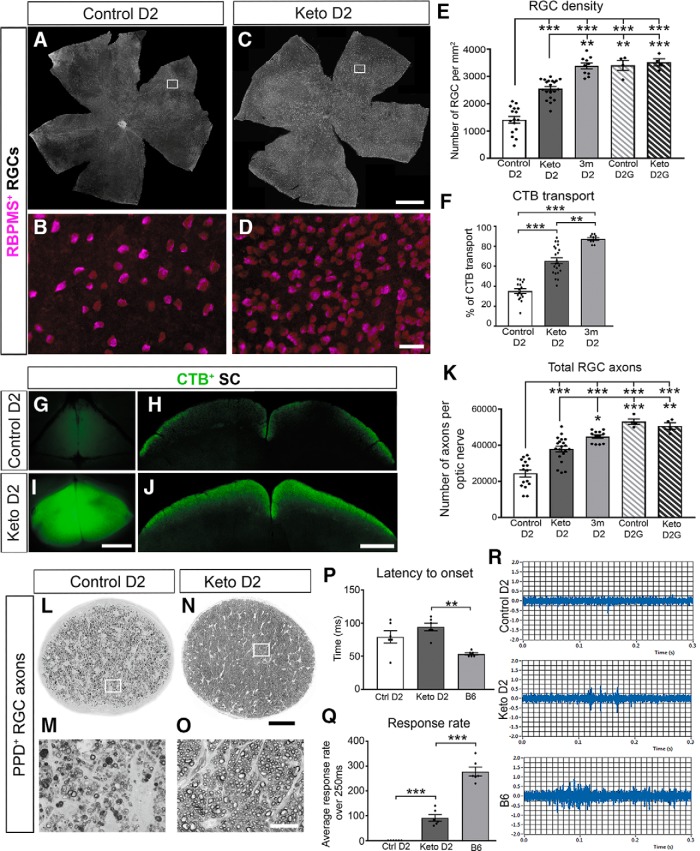
Figure 5.
Ketogenic diet preserves retinal ganglion cell structure and function. A–E, Flat mount retina immunofluorescence for RGC-specific antigen RBPMS in 11-month-old D2 mice fed a control or ketogenic (keto) diet. A, C, RBPMS+ RGCs in control and keto D2 retina. Scale bar, 500 μm. B, D, High-magnification insets of RBPMS+ RGCs. Scale bar, 50 μm. E, RGC density in D2 and D2G control and keto groups, and 3-month-old D2 mice, quantified from flat mount retinas (n = 16 control D2 mice; n = 20 keto D2 mice; n = 10 3-month-old D2 mice; n = 4 control D2G mice; n = 4 keto D2G mice). F, Percentage area fraction of CTB transported to SC from retina (n = 16 control mice; n = 22 keto mice; 10 3-month-old D2 mice). G–J, Overview and coronal sections of SC showing CTB (green) transport in the control (G, H) and keto (I, J) D2 mouse brains. Scale bars: G, I, 500 μm; H, J, 100 μm. K, Total RGC axon number as quantified in cross sections stained for PPD in control and keto D2 and D2G mice, and 3-month-old D2 ONs (n = 16 control D2 mice; n = 20 keto D2 mice; n = 10 3-month-old D2 mice; n = 4 control D2G mice; n = 4 keto D2G mice). L–O, Optic nerves stained for PPD; (L) control, and (N) keto D2 mice (n=16 control D2 mice; n=22 keto D2 mice) (n = 16 control D2 mice; n = 22 keto D2 mice; N). Scale bar, 100 μm. M, O, Magnified view of insets in L and N, respectively. Scale bar, 0.25 μm. P, Q, Latency to onset of activity (P) and average response rate (Q) to light flash over the first 250 ms of activity as measured by tungsten electrode in control, keto, and C57BL/6 (B6) SCs (n = 6 for each group; n = 3 sites/SC). No activity was detected in the control diet mouse SC. R, Example spike activity traces for Control D2 (top), Keto D2 (middle), and B6 (bottom) SCs; the first 300 ms are shown. All values are presented as the mean ± SEM, one-way ANOVA and Tukey's post hoc test. E: F(4,49) = 53.92, **p = 0.0026, ***p = 0.0001, control D2 vs keto D2G, ***p = 0.0005; F: F(2,45) = 72.04, **p = 0.00106, ***p = 0.0001; K: F(4,51) = 32.33, *p = 0.0284, ***p = 0.0001, keto D2 vs control D2G, ***p = 0.0005, control D2 vs keto D2G, **p = 0.0042; P: F(2,15) = 10.17, **p = 0.0013; Q: F(2,15) = 120.9, ***p = 0.0001.

