Figure 7.
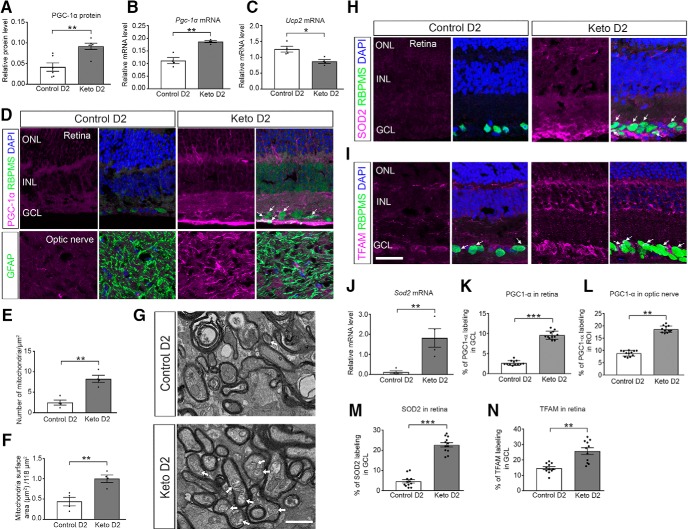
Ketogenic diet upregulates mitochondrial biogenesis and antioxidant response. A, B, PGC-1α protein (n = 6 per group; A) and Pgc1a mRNA (B) in control diet and keto D2 ONs (n = 4/group). C, Ucp2 mRNA levels in control diet and keto D2 ONs (n = 4/group). D, PCG-1α immunofluorescence (magenta) in retina (top panels; RGC marker RBPMS in green) and ON (bottom panels; astrocyte marker GFAP in green). Arrows indicate RGC somata ringed with PGC-1α labeling. E, F, Mitochondrial number (E) and mitochondrial surface area (F) in RGC axons within the ON (n = 4 ONs/group). G, Electron micrographs of control and keto D2 ONs. Arrows indicate mitochondria. H, SOD2 immunofluorescence in control diet and keto D2 retinas. Arrows indicate colocalization of SOD2 with RBPMS. I, TFAM immunofluorescence in control diet and keto D2 retina. Arrows indicate colocalization of TFAM with RBPMS. J, Sod2 mRNA levels in control diet and keto D2 ONs (n = 4/group). Quantification of immunolabeling K, PGC-1α in ganglion cell layer (GCL) of retina. L, PGC-1α in proximal myelinated ON. M, SOD2 in GCL of retina; N, TFAM in GCL of retina. All values are presented as the mean ± SEM, two-tailed unpaired t test. A: t(10) = 3.917, **p = 0.0029; B: t(6) = 5.938, **p = 0.0010; C: t(6) = 3.569, *p = 0.0118; E: t(6) = 5.332, **p = 0.0018; F: t(6) = 4.007, **p = 0.0071; J: t(6) = 5.515, **p = 0.0105; K: t(22) = 20.41, ***p = 0.0001; L: t(22) = 19.28, **p = 0.001; M: t(22) = 13.13, ***p = 0.0001; N: t(20) = 4.809, **p = 0.0018. Scale bar, I (for D, H, I), 20 μm.

