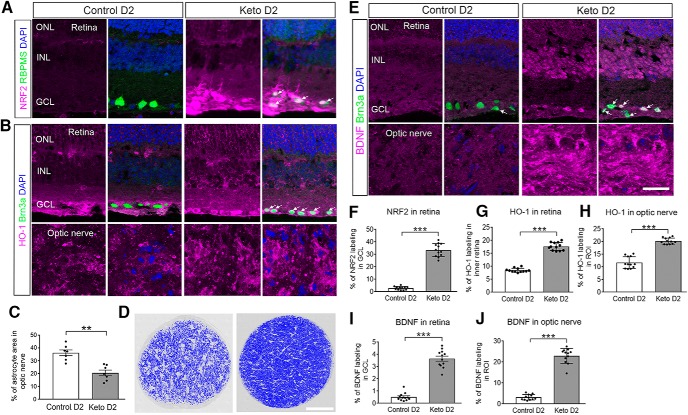
Figure 8.
Ketogenic diet upregulates antioxidant response, limits glial hypertrophy, and upregulates BDNF. A, NRF2 immunofluorescence (magenta) in control diet and keto D2 retinas. Arrows indicate somata in which Nrf2 has translocated to the nucleus of RGCs labeled with RBPMS (green). B, HO-1 (magenta) and Brn3a (green) immunofluorescence in control diet and keto D2 retina and ON (n = 4/group). C, Astrocyte hypertrophy analysis in ON cross sections from control and keto D2 mice. D, Examples of thresholding used to calculate area of astrocyte hypertrophy in control (left) and ketogenic diet (right) ONs. Scale bar, 100 μm. Dark blue areas are intact axons; light areas are astrocytes. E, BDNF (magenta) immunofluorescence in control diet and keto D2 retinas also immunolabeled for Brn3a for RGCs (green) and ONs. Arrows and white color indicate colocalization of BDNF with Brn3a. F–I, Percentage of immunolabeling by ROI across analysis depicted in A, B, and E. Analysis was undertaken in three sections per tissue, with four retinas or ONs per group. F, NRF2 in GCL of retina. G, HO-1 in inner retina. H, HO-1 in proximal myelinated ON. I, BDNF in GCL of retina. J, BDNF in proximal myelinated ON. All values are presented as the mean ± SEM, two-tailed unpaired t test. C: t(12) = 4.983, **p = 0.003; F: t(22) = 19.56, ***p = 0.0001; G: t(22) = 18.65, ***p = 0.0001; H: t(22) = 11.38, ***p = 0.0001; I: t(22) = 13.93, ***p = 0.0001; J: t(22) = 18.01, ***p = 0.0001. Scale bar, E (for A, B and E), 20 μm.

