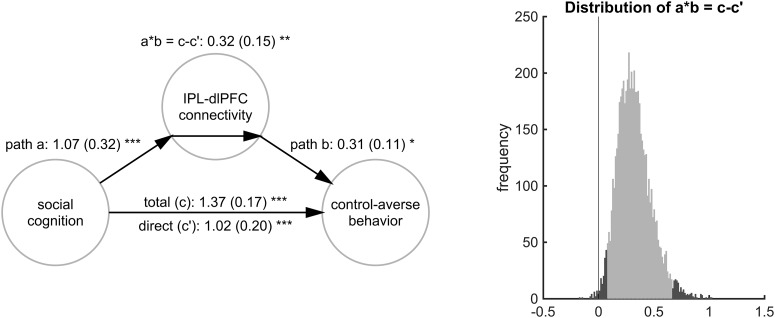
Figure 8.
Results of the mediation analysis testing the relationship among social cognition, right IPL–dlPFC connectivity, and control-averse behavior. Left, Model showing the path coefficients with SEM in parentheses, significant at *p < 0.01, **p < 0.005, ***p < 0.001. Right, Histogram of the bootstrapped distribution of the mediation effect (a*b = c–c′). The lighter gray portion of the histogram denotes the 95% CI for the effect. Data from n = 51 subjects were included in this analysis.

