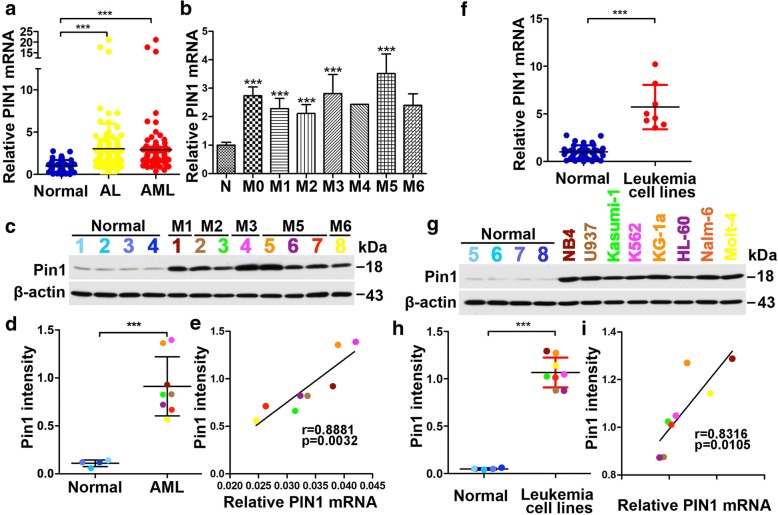
Fig. 1.
Expression of PIN1 mRNA and protein in leukemia patients and cell lines. a The fold changes of PIN1 mRNA expression in bone marrow cells from normal controls, untreated acute leukemia patients (AL) and AML patients. b The fold changes of PIN1 mRNA expression in bone marrow cells from normal controls and FAB subtypes of untreated AML patients. c, d Pin1 protein levels in bone marrow cells from normal and AML patients were analyzed by immunoblotting (c). The quantitative results of Pin1 expression was analyzed from 1c (d). The individual patients used for immunoblot analysis were indicated by different colors. e The correlation between PIN1 mRNA and Pin1 protein levels in AML patients. Different colors were used to indicate different patients in 1c and 1d. f The fold changes of PIN1 mRNA expression in normal control bone marrow cells and several leukemia cell lines, including AML cells (Kasumi-1, U937, K562, NB4 and KG-1a) and ALL cells (Nalm-6 and Molt-4). g, h The protein levels (g) and quantitative results (h) of Pin1 in normal control bone marrow cells and leukemia cell lines. Different cell lines were indicated by corresponding colors. i The correlation between PIN1 mRNA and Pin1 protein levels in leukemia cell lines was analyzed based on 1f and 1 h. Individual cell lines were indicated by corresponding colors. Statistically significant differences using Student’s t test are indicated by p values. (*p < 0.05, **p < 0.01, ***p < 0.001)

