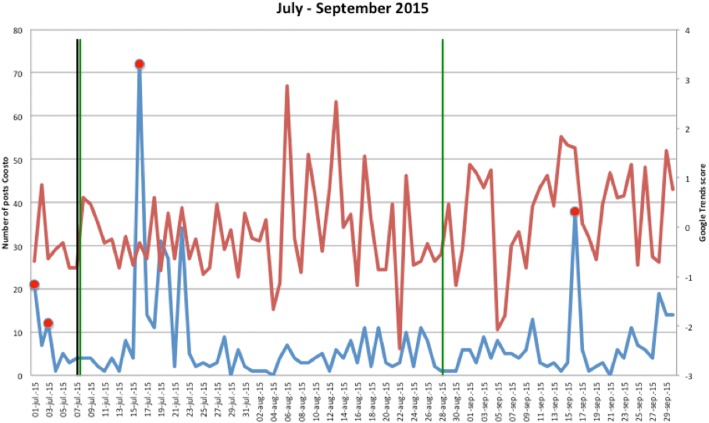
Fig. 3.
MRSA outbreaks in The Netherlands, per quarter of a year. The blue line is the number related to MRSA detected by Coosto, with a red dot indicating days with ≥10 posts related to an outbreak, the red line the Google Trends score. The vertical bars represent outbreaks reported to SO-ZI/AMR: blue for teaching hospitals, black for regular hospitals, green for nursing homes, yellow for other locations, and red for unknown locations

