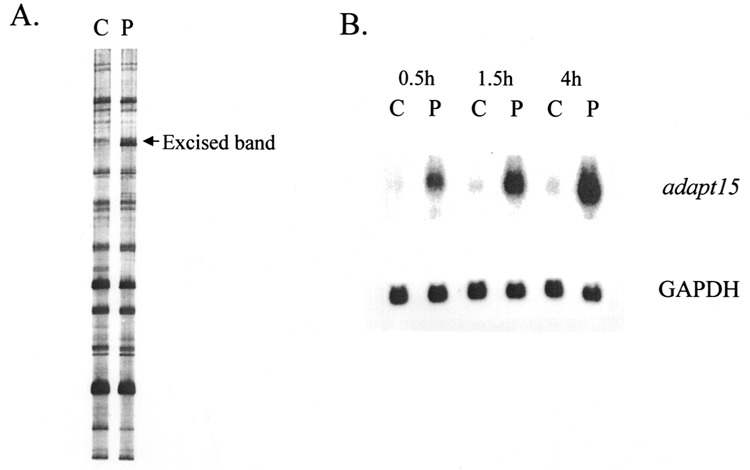
Figure 1.

Example of using differential display to identify a modulated mRNA. (A) Representative differential display gel comparing the mRNA expression (as PCR DNA fragments) in control versus 4-h peroxide-treated HA-1 cells treated as described in Materials and Methods. C, control sample lane; P, peroxide-treated cell sample lane. Arrow denotes candidate band. (B) The candidate band denoted in (A) was excised, reamplified, cloned, radiolabeled, and used to probe a Northern blot containing RNA extracted from HA-1 hamster cells at multiple time points after peroxide exposure. The Northern blot was also probed with glyceraldehyde-3-phosphate dehydrogenase (GAPDH) cDNA as a loading control.
