
Figure 4.
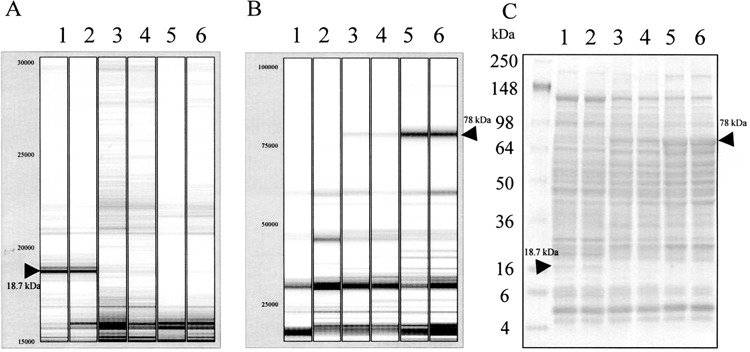
Comparison of SELDI protein profiles with SDS-PAGE protein profile. (A) Virtue gel format (gel view) of SELDI protein profile in low mass range (15000–30000 Da) on SAX2 array. (B) Virtue gel format (gel view) of SELDI-TOF protein profile in high mass range (23000–100000 Da) on IMAC-Cu array. (C) 4–20% gradient SDS-PAGE gel loaded with 75 μg mouse liver protein. Lanes 1 and 2: wild-type; lanes 3 and 4: AOX−/−; lanes 5 and 6: wild-type treated with Wy14,643. Arrows indicate the differentially expressed proteins of 18.7 and 78 kDa identified by SELDI ProteinChip System and SDS-PAGE, respectively.