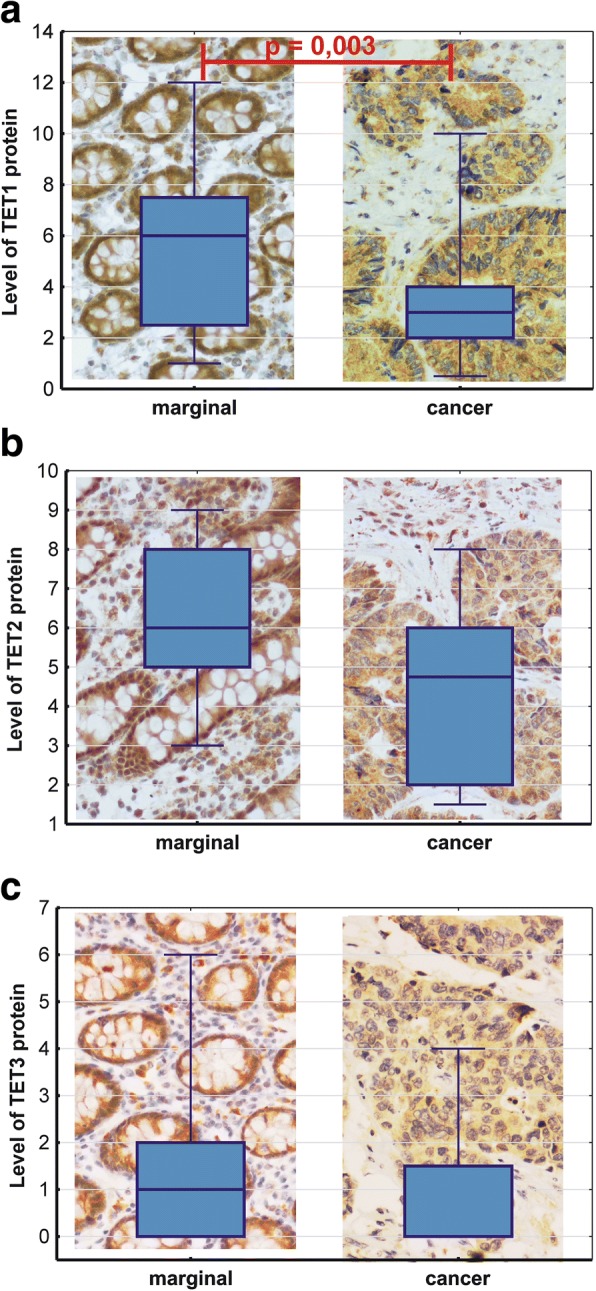
Fig. 4.

Expressions of TET1 (a), TET2 (b), and TET3 (c) protein in normal colonic tissue and cancer tissue (CRC, n = 19). Marker in the center of the box represents median value. The length of each box (IQR, interquartile range) represents the range of values for 50% of the most typical observations, and its edges correspond to the first and third quartile. Whiskers represent variance outside the upper and lower quartile. P value was determined with Mann-Whitney U test
