Figure 1:

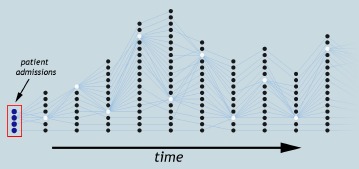
An example tracking graph showing patient progression over time. Each node represents a patient group and its “track” shows how that group progresses over time.

An example tracking graph showing patient progression over time. Each node represents a patient group and its “track” shows how that group progresses over time.