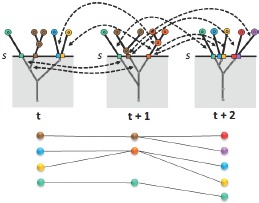
Figure 3:

Tracking graph construction. At similarity threshold s, first, patient groups existing at that value are obtained from corresponding patient hierarchies. Then, the meta-graph is used to extract correlation details. Here, the correlations extracted are indicated with black arrows. The resulting tracking graph is displayed at the bottom.
