Figure 4.

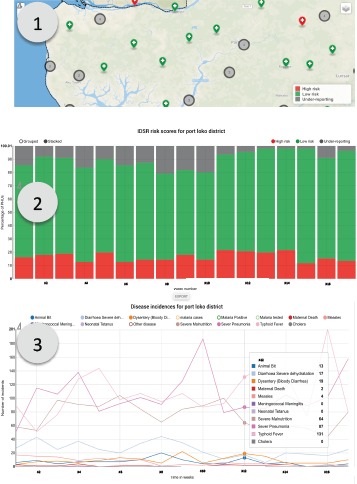
IDSR Report page showing (1) health facilities color coded by their current risk level, (2) cumulative reporting rates for the chosen geographic area and (3) disease incidence trends for the chosen geographic area.

IDSR Report page showing (1) health facilities color coded by their current risk level, (2) cumulative reporting rates for the chosen geographic area and (3) disease incidence trends for the chosen geographic area.