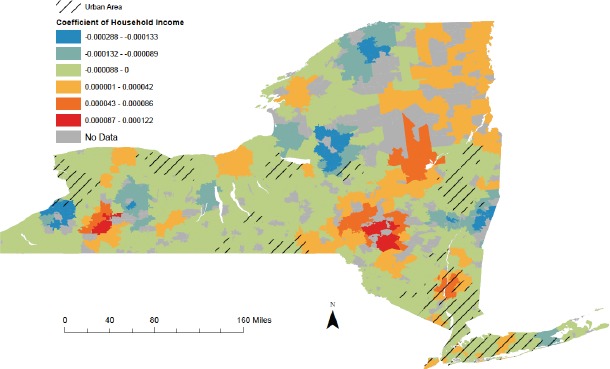
Figure 5.

The choropleth map that visualizes Geographically Weighted Regression (GWR) local coefficient of household Income for opioid poisoning incidence rate by ZIP code in New York State, 2010-2014.

The choropleth map that visualizes Geographically Weighted Regression (GWR) local coefficient of household Income for opioid poisoning incidence rate by ZIP code in New York State, 2010-2014.