Figure 2.

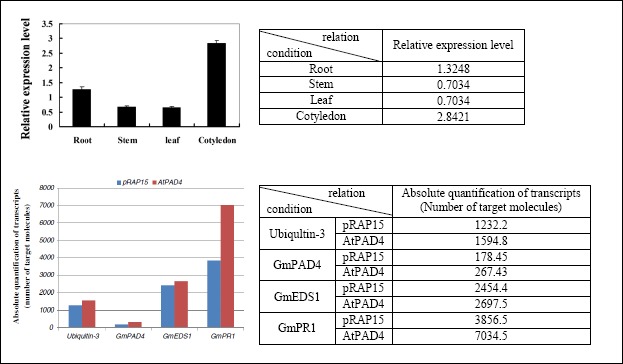
Two examples of bar charts from biomedical publications (PMC4655237 and PMC3648381) with tables showing the relations that could be extracted from them.

Two examples of bar charts from biomedical publications (PMC4655237 and PMC3648381) with tables showing the relations that could be extracted from them.