Figure 2.

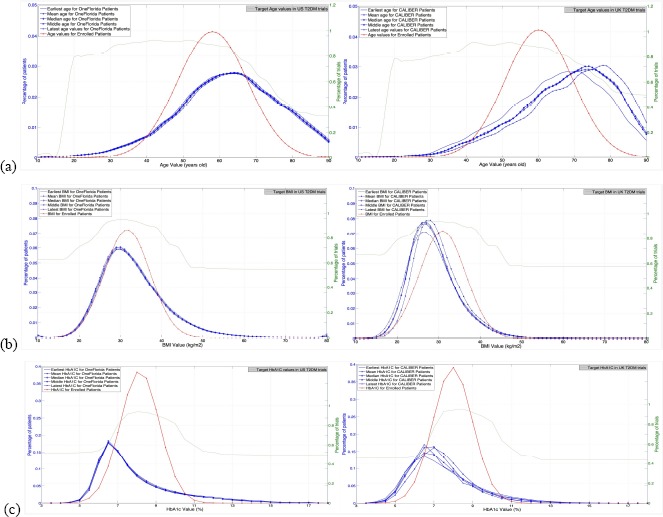
Visualization of (a) age, (b) BMI, and (c) HbA1c in the target populations and study populations of US and UK-based T2DM trials, respectively.

Visualization of (a) age, (b) BMI, and (c) HbA1c in the target populations and study populations of US and UK-based T2DM trials, respectively.