Figure 3.1.

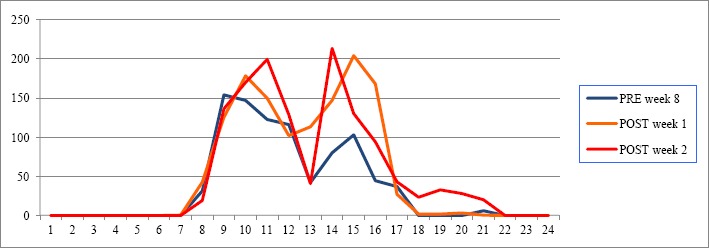
The visualization of the number of off-hour logs of the provider BC3-04. X-axis represents the hours of a day and Y-axis represents the number of logs of all providers.

The visualization of the number of off-hour logs of the provider BC3-04. X-axis represents the hours of a day and Y-axis represents the number of logs of all providers.