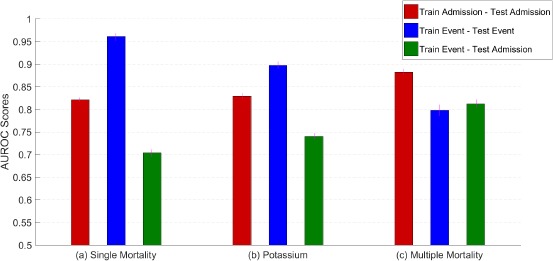
Figure 2.

AUROC scores for the single mortality prediction, hypokalemia prediction, and multiple mortality prediction setups. The legend indicates the training set and test set schemes for each bar. Errors are denoted with purple lines at the top of each bar. Observe that for the single mortality and hypokalemia tasks, the experiment using both an event-dependent training set and an event-dependent test set yields very high performance indicating the clear bias present in those formulations.
