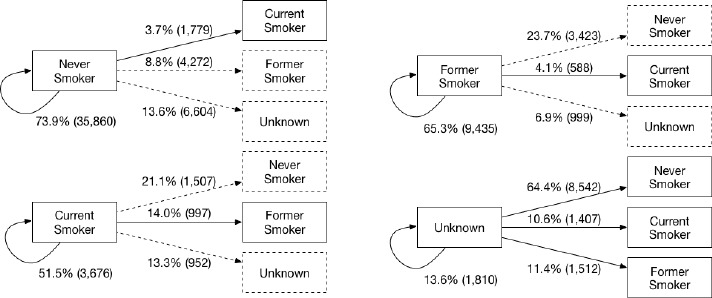
Figure 1.

Changes of smoking status overtime. Dashed changes demonstrate implausible discrepancies and continuous lines represent plausible changes in longitudinal data. The number of changes recorded in our sample is reported in parentheses and the percentage it represents for each category is included in the figure.
