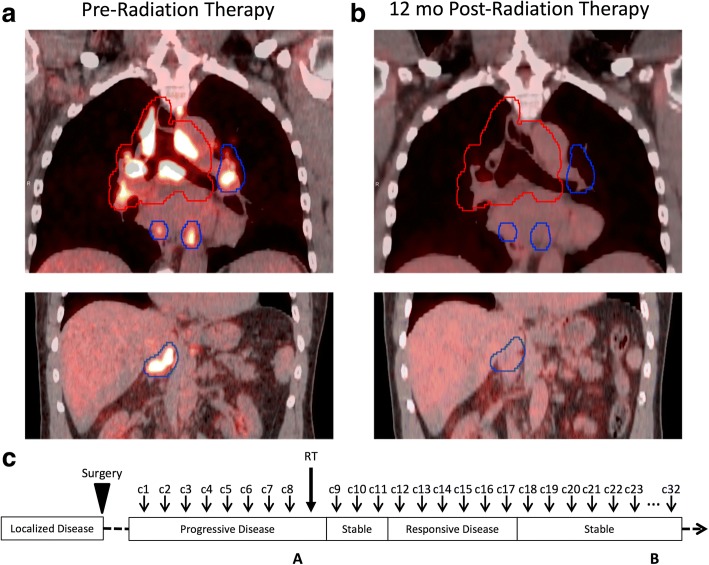
Fig. 2.
Case B. FDG-avid adenopathy before and after RT with target volume outlined in red and untreated disease outlined in blue. Left (Panel a): Coronal pre-RT PET/CT demonstrating mediastinal FDG-avid adenopathy in the mediastinum and bilateral hila (top) and upper abdomen (bottom); not pictured: supraclavicular adenopathy. Right (Panel b): Coronal PET/CT at 12 months after RT demonstrating radiographic response in the mediastinum and bilateral hila (top) and radiographic response in the upper abdomen (bottom). Panel c: Timeline of therapy and disease status, with A and B corresponding to time points depicted in Panel a and b above. c1 = cycle 1 of pembrolizumab. RT = radiation therapy. PET/CT = positron emission tomography/computed tomography. FDG = fludeoxyglucose

