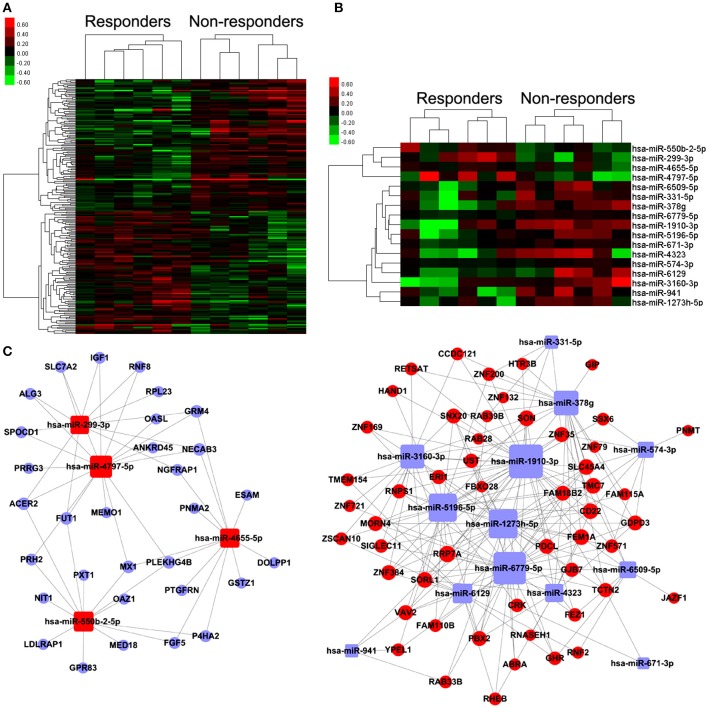
Figure 2.
Differentially expressed mRNAs and miRNAs, and miRNA-mRNA coexpression network associated with response to TG tablets. (A,B) Heat map showing hierarchical clustering of mRNAs and miRNAs, whose expression changes were more than 1.5-fold in the comparison between the responder and non-responder groups. In clustering analysis, up- and down-regulated genes are colored in red and green, respectively. (C) miRNA-target gene co-expression network constructed using the differentially expressed miRNAs and their corresponding putative targets which were also distinctly expressed between the responder and non-responder groups. Red and blue square nodes respectively refer to the upregulated and downregulated miRNAs in the responder group compared to the non-responder group. Red and blue circle nodes respectively refer to the upregulated and downregulated mRNAs in the responder group compared to the non-responder group. The sizes of the nodes were represented by degree that is the contribution of one miRNA to the genes around or the contribution of one gene to the miRNAs around.

