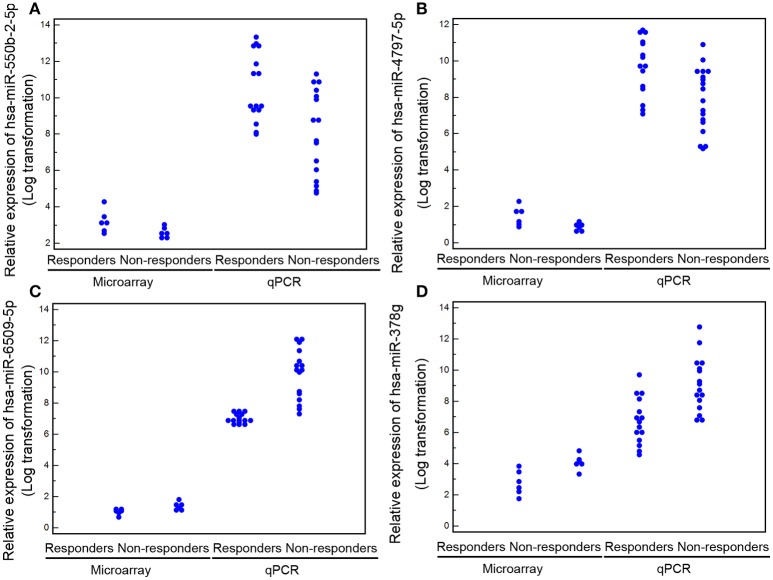
Figure 4.
Levels of the four candidate miRNA biomarkers (A) for hsa-miR-550b-2-5p; (B) for hsa-miR-4797-5p; (C) for hsa-miR-6509-5p; (D) for hsa-miR-378g) in peripheral blood detected by microarray and quantitative PCR analyses. Data are represented as the mean ± S.D. (n = 6 for each group in the discovery cohort; n = 16 and 15 for non-responder and responder groups in the validation cohort).

