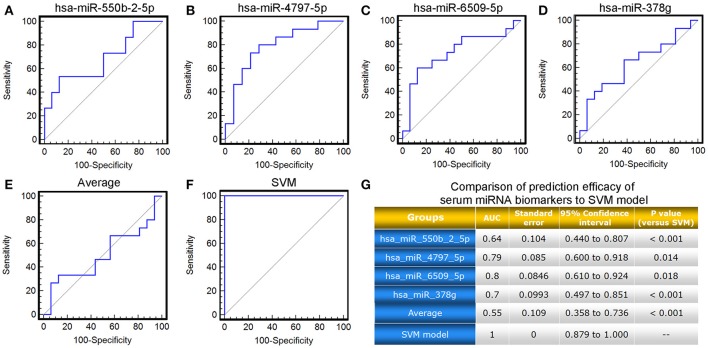
Figure 5.
ROC comparison of the four candidate miRNA biomarkers, their average level with the SVM-based model in predicting response to TG tablets. (A–F) ROC curves of hsa-miR-550b-2-5p, hsa-miR-4797-5p, hsa-miR-6509-5p, hsa-miR-378g, the average of their levels, the SVM-based model in predicting response to TG tablets. (G) Statistical significance in ROC comparisons of the four candidate miRNA biomarkers, their average serum level with the SVM-based model in predicting response to TG tablets.

