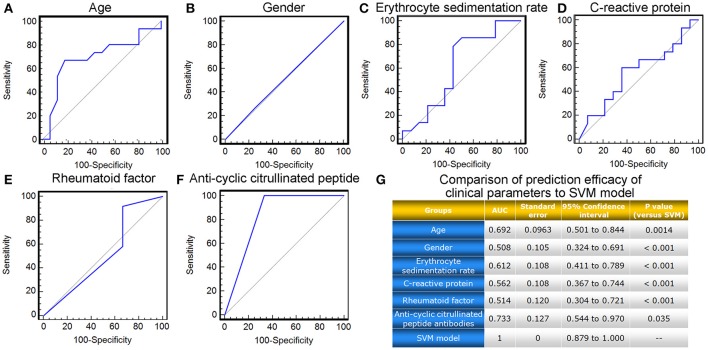
Figure 6.
ROC comparison of various clinical parameters with the SVM-based model in predicting response to TG tablets. (A–F) ROC curves of age, gender, erythrocyte sedimentation rate, C-reactive protein, rheumatoid factor and anti-cyclic citrullinated peptide antibodies in predicting response to TG tablets. (G) Statistical significance in ROC comparisons of various clinical parameters with the SVM-based model in predicting response to TG tablets.

